| |

TensorFlow DebuggingDebugging is a tedious and challenging task. We have to written code and identifying problems through tensorflow debugging. Typically there are many guides, and the process of debugging is often well documented for many languages and frameworks. TensorFlow has its debugger called the tfdbg TensorFlow Debugging, which lets us observe the essential working and the state of the running graph. These are difficult to debug with any debuggers like pdb in python. This tutorial will deal with teaching us how to use the tfdbg CLI to debug the appearance of nans and icons, which are the most common types of bugs found in the tensor flow. Given below is a low-level API example. Python-m tensorflow.python.debug.examples.debug_mnist The code is given above train a neural network for MNIST digit image recognition, and accuracy increases before saturating after several steps. This error can the infs and nans, which have the most common bugs. Now use tfdbg to debug the issue and know where exactly the problem starts. Wrapping TensorFlow sessions with tfdbg Add the below line of code to use tfdbg and contain the session object using the debugger wrapper. The wrapper class offers some added features, which include: CLI can be called before and after Session. run () if we wish to take control of the execution and know the internal state of the graph. Filters can be added to assist the diagnosis. In the provided example, there is a filter called tfdbg.has_inf_or_nan, which determines the presence of Nan or inf in any in-between tensors, which are neither inputs nor outputs. We are always free to write our code for custom filters that suit our needs, and we can look at the API documentation for additional information for the same. Debugging TensorFlow Model Training with tfdbg,It's time to train the model with including the-debug flag: The fetched data can be displayed on the screen and look like the image shown below: 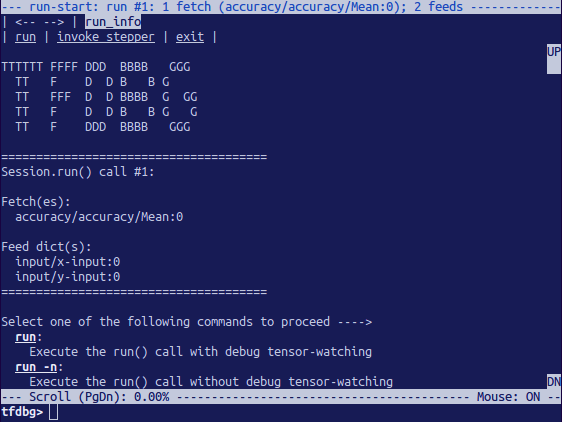
The above picture is the run-start interface. After this, enter the r at the prompt: tfdbg>run This will make the TensorFlow debugger run if the next session call, calculate the accuracy for the test dataset. For example: 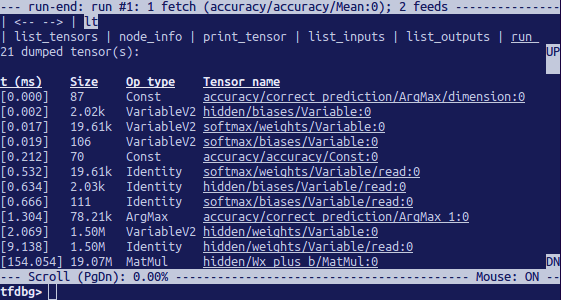
We can list the tensors using command after we've executed run. Frequently-Used TensorFlow Debugging CommandsSee the following commands at the tfdbg> prompt: Note that whenever we enter a command, a brand new display output will be seen. That is analogous to internet pages in the browser. We may navigate between those screens by clicking the <-and-> text arrows close to the top-left corner of the CLI. Features of tfdbg CLISimilarly, like TensorFlow debugging commands indexed above, the tfdbg CLI gives the subsequent additional capabilities: To navigate through preceding tfdbg instructions that commenced with the one's characters. To navigate through preceding tfdbg instructions, type in some characters accompanied by the up or down arrow keys. Tfdbg will show us the history of instructions that commenced with one's attitudes. To navigate through the records of screen outputs, do both of the following: Click underlined <-and-> hyperlinks close to the pinnacle left the corner of the display screen. To redirect the display screen output to a record in preference to the screen, quit the command redirects the output of the pt command to the Finding nans and infsOn this first consultation Run () call, It takes place to be no intricate numerical values. We can move to follow run by the usage of the command run or its shorthand r. We can additionally use the -t flag to transport before and some of the Session. Run () calls at a time, Run() calls without stopping on the run-start or run-stop activate, till the primary Nan or inf value in the graph. That is analogous to conditional breakpoints in the procedural-language debugger in tensorflow: The preceding command works good because a tensor clears out known as has_inf_or_nan has been registered for use when the wrapped consultation is created. See the API document for more statistics at the expected signature and go back to a value of the predicate callable used with add_tensor_filter(). 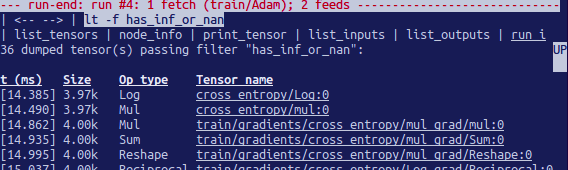
Because the display suggests on the primary line, the has_inf_or_nan filter out is first brought about the fourth consultation. Run() call: The Adam optimizer ahead-backward education skip the graph. In this Run, 36 intermediate tensors incorporate nan or inf values. Scroll down a touch, and we'll word some scattered inf values. If the instance of inf and Nan are hard to identify by eye, we may use the following command to perform a regex seek and spotlight the output: Or, as a substitute: We can additionally use the-s or -numeric_summary command to get a summary of the sorts of numeric values within the tensor: We can see that several of the thousand elements of the cross_entropy/Log: zero tensors are -infs (negative infinities). 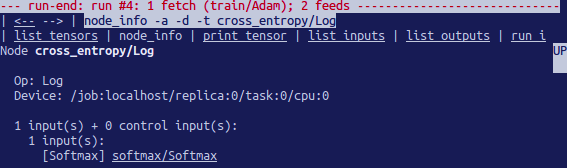
We see that this node has the op type log and that its input is the node softmax. Then run the subsequent command to take a more in-depth observe the input tensor: Take a look at the values in the enter tensor, looking for zeroes: Now it is clear that the foundation of the terrible numerical values is the node cross-entropy/Log talking logs of zeros. To find out the wrong line within the python supply code, use the -t flag of the ni command to show the traceback of the node's production: tfdbg>ni -t cross_entropy/Log In case we click "node_info" at the top of the display, tfdbg mechanically suggests the traceback of the node's creation. From the traceback, we see that the op is built at the following line: debug_minist.Py: It can annotate lines of a python record with the pops or tensors crested with the aid of them. 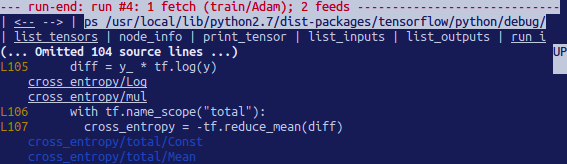
Next TopicFixing Problem in TensorFlow Debugging
|
 For Videos Join Our Youtube Channel: Join Now
Feedback
- Send your Feedback to [email protected]
Help Others, Please Share


