| |

Three Inside Up/DownThe phrases "three inside up" & "three inside down" correspond to two candle reversal patterns on candlestick charts, each comprising three different candles. The pattern, which must appear on three consecutive candles, indicates that the present trend has lost pace and that a move in the opposite direction may be about to begin. 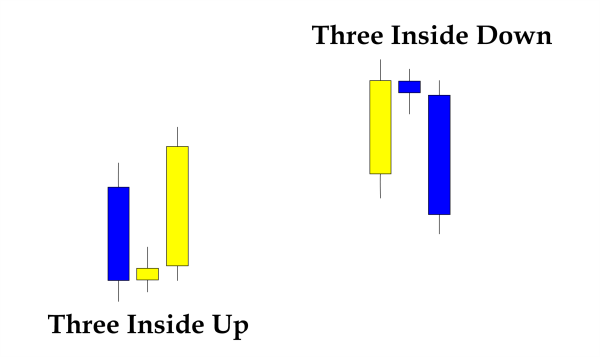
Key Takeaways
What is Candlestick Pattern?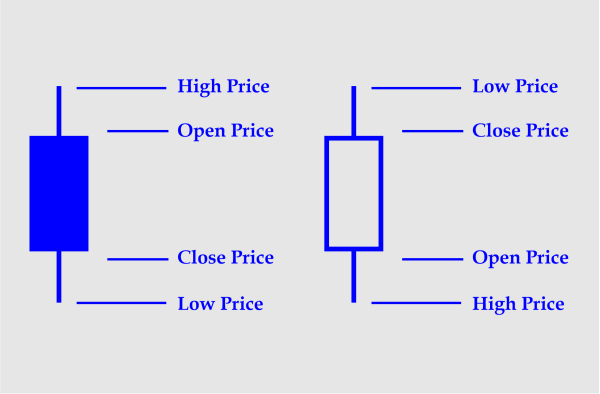
A specialised technique called a candlestick chart condenses data from many periods into a single price bar. They are, therefore, more beneficial than conventional open, high, low, and close (OHLC) bars or straight lines that link closing price dots. Candlesticks create patterns that, when finished, may be used to forecast price movement. This vibrant technical tool, which Japanese rice dealers first used in the 18th century, gains depth via proper colour coding. Candlesticks are often employed daily with the theory that each candle represents a full day's work of news, data, and commodity price. This implies that swing or longer-term traders might benefit more from candles. Most importantly, every candle has a tale to tell. The best way to look at a candle is as a competition between sellers and buyers. Light candlelight (green or white are usual default displays) indicates that the day belonged to the purchasers, whilst a dark candlestick (red or black) indicates that the day belonged to the sellers. But what makes candlesticks so appealing as a charting tool is what transpires between the open and the close and the struggle between buyers and sellers. Few Characteristics
To help you comprehend the many components of a candlestick, let's first look at some basic information about candles. How to read a Candlestick Pattern?A daily candlestick depicts a market's OHLC (opening, high, low, and closing) prices. A dark colour (usually red or black) indicates a price decrease, while a light colour (usually green or white) indicates a rise in price on the rectangular "actual body" or "just body". Wicks or tails, the lines over and below the body, stand for the day's highest and lowest points. When combined, the components of a candlestick may usually indicate changes in the trend of a market or show significant prospective moves, which frequently need to be verified by the candle of the following day. Understanding the Three Inside Up/Down Candlesticks PatternsThe bullish-up variation of the pattern shows that a rise higher may be the beginning and that a move below may be coming. The pattern's properties are listed below:
The pattern's downward variation is bearish. It indicates that the price is beginning to fall lower after its recent upward movement. The pattern's properties are listed below:
The last affirmation candle, which numerous investors wait for during the harami (a two-candle pattern, long and small), is what follows the three inside patterns and then is referred to as harami patterns. Three Inside Up-Down Trader PsychologyThree Inside Up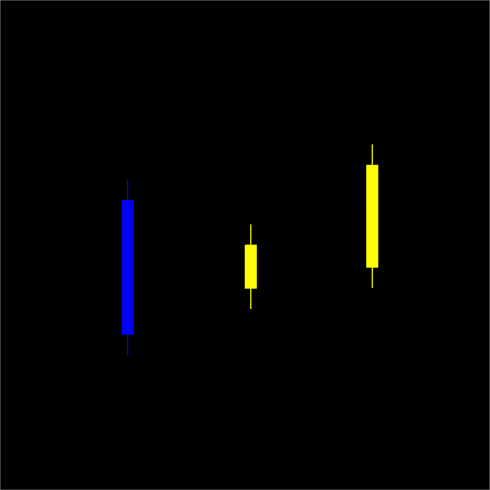
On the first candle, a significant sell-off overview that posted new lows earlier continues the downtrend. This deters buyers while boosting seller confidence. The trading range of the first candle is where the second candle opens. It finishes higher than both the previous close as well as the current open rather than continuing downward. Some short-term short traders may take advantage of this price action's warning sign as a chance to sell their short positions. A bullish reversal is complete with the third candle, trapping any lingering short sellers and luring anyone looking to open a long position. Three Inside Down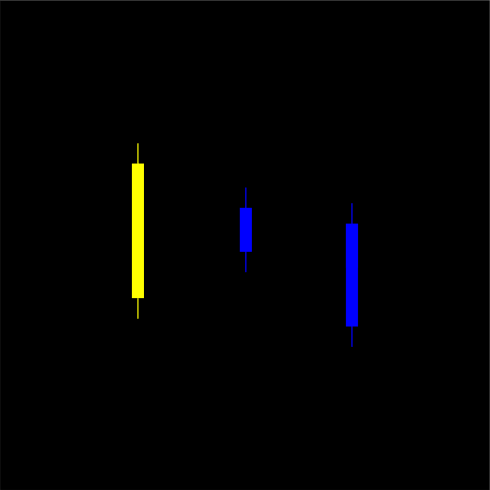
With the first candle, the uptrend is still there, and a sizable rise has posted new highs. The second candle begins trading inside the range of the first candle and ends below the first candle's close and existing open. The purchasers are alarmed by this and may start liquidating their long bets. The third candlestick completes a bullish reversal, forcing additional long positions to contemplate selling and allowing short sellers to enter to profit from the price decline. Trading the Three Inside Up/Down Candlestick PatternThere is no requirement to trade the three inside up/down patterns. It may be utilised as a simple warning that the direction of the short-term price movement might be shifting. For those who want to start trading it, a long account may be created either on the next open for a bearish three inside up or after the day on the third candle. Underneath the negligible of the third, 2nd, or first candle, a breakpoint can be set up. This depends upon the trader's willingness to assume risk. A trader might enter short for a bullish three inside down around the close of the day during the third candle or the beginning of the following day. Over the third, middle, or first candle high, a stop loss can be set up. There are no profit objectives for these designs. Therefore, if gains arise, it is advisable to use a different strategy to determine when to seize them. Examples of how to do this include utilising a lagging stop loss, leaving at a specified risk/reward proportion, or using technical analysis or other candle patterns to indicate an exit. Since the sequence is pretty typical, it is not always trustworthy. Additionally, the pattern is short-term in nature, which could result in only a small to medium move in the new direction, even though it occasionally causes significant trend changes. According to the design, the price might not move in the anticipated direction but instead turnabout and go back in line with the initial trend. Trading consistent with the overall trend may enhance the pattern's functionality. Therefore, during a retracement in an overall uptrend, think about searching for the three inside up. This may mean the downturn is finished, and the upswing is starting again. Watch for the three inside down after a small advance higher during a downtrend. This may indicate that the upward trend has ended, and the downturn is starting again. Based on the trend of inside up or inside down, trades can be made accordingly. However, these are conceptual approaches. Example of Three Inside Up/Down Candlestick PatternAn Illustration of a three-inside-down sequence that fails can be seen in the Meta (previously Facebook Inc.) chart below. The 3rd candle is relatively modest and doesn't exhibit a lot of sales conviction, although appearing during a significant price increase. The price soon continues trading to the upside the following day, in line with the more important trend. 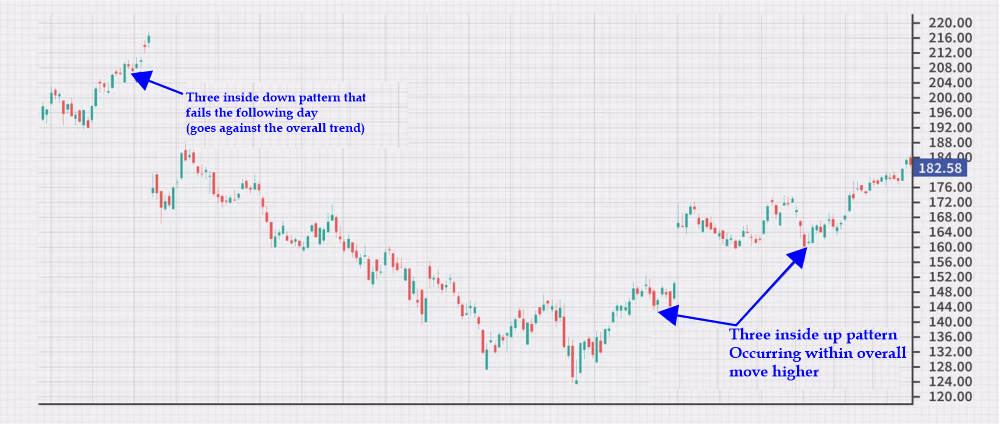
The following dances occur during and in opposition to general price increases. The price starts to climb higher once the pattern appears, but not always straight. Both times, after the way, the price stops before rising. To avoid being abruptly halted out on a long position, it would have been wise to have a stop loss set below the whole pattern.
Next TopicThree-Sigma Limits
|
 For Videos Join Our Youtube Channel: Join Now
Feedback
- Send your Feedback to [email protected]
Help Others, Please Share


