| |

UML State Machine DiagramThe state machine diagram is also called the Statechart or State Transition diagram, which shows the order of states underwent by an object within the system. It captures the software system's behavior. It models the behavior of a class, a subsystem, a package, and a complete system. It tends out to be an efficient way of modeling the interactions and collaborations in the external entities and the system. It models event-based systems to handle the state of an object. It also defines several distinct states of a component within the system. Each object/component has a specific state. Following are the types of a state machine diagram that are given below:
Why State Machine Diagram?Since it records the dynamic view of a system, it portrays the behavior of a software application. During a lifespan, an object underwent several states, such that the lifespan exist until the program is executing. Each state depicts some useful information about the object. It blueprints an interactive system that response back to either the internal events or the external ones. The execution flow from one state to another is represented by a state machine diagram. It visualizes an object state from its creation to its termination. The main purpose is to depict each state of an individual object. It represents an interactive system and the entities inside the system. It records the dynamic behavior of the system. Notation of a State Machine DiagramFollowing are the notations of a state machine diagram enlisted below: 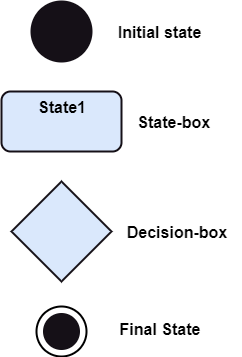
Types of StateThe UML consist of three states:
How to Draw a State Machine Diagram?The state machine diagram is used to portray various states underwent by an object. The change in one state to another is due to the occurrence of some event. All of the possible states of a particular component must be identified before drawing a state machine diagram. The primary focus of the state machine diagram is to depict the states of a system. These states are essential while drawing a state transition diagram. The objects, states, and events due to which the state transition occurs must be acknowledged before the implementation of a state machine diagram. Following are the steps that are to be incorporated while drawing a state machine diagram:
When to use a State Machine Diagram?The state machine diagram implements the real-world models as well as the object-oriented systems. It records the dynamic behavior of the system, which is used to differentiate between the dynamic and static behavior of a system. It portrays the changes underwent by an object from the start to the end. It basically envisions how triggering an event can cause a change within the system. State machine diagram is used for:
Example of a State Machine DiagramAn example of a top-level state machine diagram showing Bank Automated Teller Machine (ATM) is given below. Initially, the ATM is turned off. After the power supply is turned on, the ATM starts performing the startup action and enters into the Self Test state. If the test fails, the ATM will enter into the Out Of Service state, or it will undergo a triggerless transition to the Idle state. This is the state where the customer waits for the interaction. Whenever the customer inserts the bank or credit card in the ATM's card reader, the ATM state changes from Idle to Serving Customer, the entry action readCard is performed after entering into Serving Customer state. Since the customer can cancel the transaction at any instant, so the transition from Serving Customer state back to the Idle state could be triggered by cancel event. 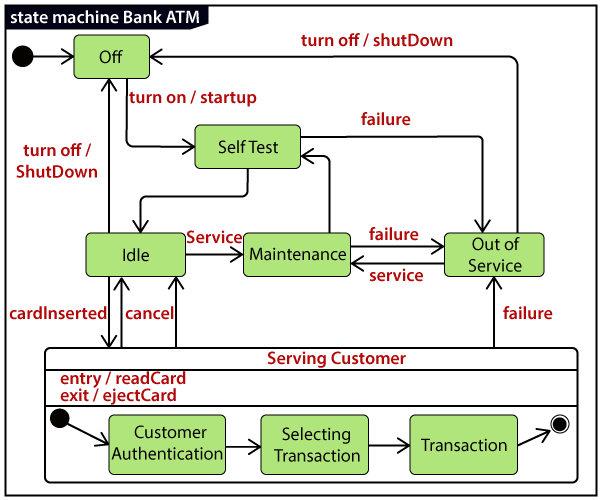
Here the Serving Customer is a composite state with sequential substates that are Customer Authentication, Selecting Transaction, and Transaction. Customer Authentication and Transaction are the composite states itself is displayed by a hidden decomposition indication icon. After the transaction is finished, the Serving Customer encompasses a triggerless transition back to the Idle state. On leaving the state, it undergoes the exit action ejectCard that discharges the customer card. State Machine vs. Flowchart
Next TopicActivity Diagram
|
 For Videos Join Our Youtube Channel: Join Now
Feedback
- Send your Feedback to [email protected]
Help Others, Please Share


