| |

What Is the 200-Day Simple Moving Average200-Day Simple Moving AverageThe 200-day SMA, which covers roughly 40 weeks of trading (roughly comparable to 10 months of trade), is a long-term trend gauge and has applications ranging from trading to risk management. However, it's simply a tool like any other analyzing and measurement tool, and so its advantages are limited by the ability and experience of its user rather than its value. Some argue that this indication is a remnant of the past, harkening back to the days when charts were produced by hand and values were rounded to facilitate faster computation. 
Now that we've examined the concept, we can conclude that it is the most straightforward technique in the trading game, which tells us to move in when the market price is above the average and move out when the market price is below the average price. The approach is somewhat useful for all the trending approaches like a stock, commodity, or whatever instrument is being charted. HistoryThe 200-day SMA has long roots in the past and has consistently helped people in trend analysis as a filter for decision-making. For a simple example, let's review the historical behaviour of the S&P 500 when such approaches were utilized: According to a sample size of 12,814 since 1950, when the S&P 500 was above its 200-day moving average, median gains have tended to return 2.77% with a 70.10% success rate during the next trading quarter. According to a sample size of 5,172, when the S&P 500 was below its 200-day moving average, median gains have tended to return 1.83% with a 56.97% success rate during the next quarter of trading. While it is worth noting that median gains have historically been favourable when the index ended below its 200-day moving average, median profits have been smaller than when the index closed above the norm, with a substantially lower win rate that is just marginally better than the toss of a coin. Earnings at the 20th percentile are also noteworthy: -1.95% when the market closes above the average vs -5.64% when the market closes below the average. Again, even if returns have traditionally been positive, this does not mean that risk has remained constant. If investors relied only on this approach, history suggests a substantially higher risk of a more severe collapse when the index falls below the moving average. Experts believe that positive returns achieved when the index is below the moving average are due to the market's inclination to climb over time. However, a more rigorous examination of the restricted data may lead to different conclusions. How to calculate it?It is determined by dividing the total closing prices for each of the previous 200 days by 200, as follows: 200-day SMA Formula = [(Day 1 + Day 2 …. + Day 200)/200] Each day produces a new data point, and connecting all of the data points for each day results in a continuous line on the charts. 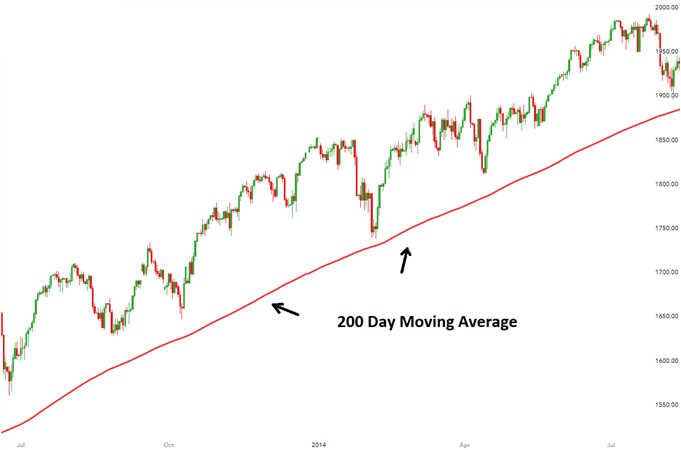
What are the different roles it plays in a trading strategy?The 200-day moving average has grown in popularity because it can be used to help traders in a variety of ways, including: As a Tool for both Support and OppositionIt may detect previously agreed fundamental levels in the foreign exchange market. In the forex market, prices frequently approach and bounce off the 200-day moving average before continuing in the direction of the current trend. As a result, the 200-day moving average may be used to determine dynamic support or resistance. When the price rebounds off the 200-day moving average in an up-trending market, traders will attempt to go long. Similarly, in a down-trending market, traders may seek short entry once the price surges from the 200-day moving average. As a Trend FilterLooking at the market with respect to the 200-day moving average line is one of the most fundamental strategies for using the 200-day moving average. Traders frequently use this to assess the overall market trend and only trade in the general area of the long-term trend. In this way, it typically acts as a trend filter. In MA CrossoversOnce the long-term trend has been determined, traders frequently measure the movement's strength. This is significant because a weakening trend may indicate a trend reversal and provides an excellent opportunity to exit an existing trade. Shorter-term moving averages, such as the 21, 55 and 100-day moving averages, help traders identify whether an established trend is losing momentum since they reflect more recent price moves over a shorter period. Trend and its Importance in the 200-Day Moving Average StrategyBefore delving into data and testing, it's critical to understand fundamental principles for evaluating findings: trend and trend identification. It gives the most obvious definition: a general propensity or inclination. Asset classes tend to trend over long and short durations, with extended timeframes magnifying the trend. Even on lengthy timescales, however, price movements are muddy and unstable, frequently bouncing around a point of central tendency. The 200-day moving average's statistic provides a level of smoothing by assigning equal weight to every trading day in the past 200 days, allowing the user to better assess the direction and relative price position regarding the long-term trend. Its ShortcomingsThere is one crucial downside with every moving average, which is usually latency. Despite the seemingly limitless innovation of market professionals over the years, moving averages are notoriously slow to change. This is considered their (moving average approaches) most important advantage when prices move sporadically and their most important disadvantage when the trend reverses. As previously stated, no signal should stand alone without a combination of additional metrics in the user's intended system to reach a conclusion. Digging further into the historical data, we may find a similar dynamic for S&P 500 Sector ETF performance when the index closed above and below its 200-day moving average. Based on a sample size of 40393, the median sector ETF performance since 1999, when the S&P 500 closed above its 200-day moving average, was a gain of 2.54%, with a 65.23% win rate in the next trading quarter. When the S&P 500 fell below its 200-day moving average in 1999, the median sector gained 2.46%, with a 58.55% win rate in the next quarter of trading. Whenever the sector ETF group's median gains were both positive, some investors saw lower win rates and greater declines around the 20th percentile. This concludes that when the S&P 500 is trading below its 200-day moving average, it suggests a higher level of risk, depending on the previous historical data. Final ThoughtsFor as long as investors, analysts and money managers have put pen to paper; the 200-day moving average has been an important predictor of the long-term trend. It has withstood the test of time and market history to become one of the most critical indicators in numerous charting systems. In terms of risk management, this indicator has historically shown to be a valuable tool that investors may use to restrict exposure to market settings with a higher-than-normal loss potential. Because of its widespread use, the 200-day moving average is sometimes regarded as a self-fulfilling prophecy. Is the 200-day moving average absolutely perfect? The answer is straightforward - "obviously not." There are several methods for calculating moving averages for different time durations and adjusting the lookback periods for various periods and investor choices. Furthermore, the 200-day moving average should always be used as part of an established system, not as the only proven component. Although this indication is far from the pinnacle of trading systems, it is worth mentioning that it has consistently stood the test of time as an effective risk management tool.
Next TopicCommercial Policy
|
 For Videos Join Our Youtube Channel: Join Now
Feedback
- Send your Feedback to [email protected]
Help Others, Please Share


