| |

Working with Heat Map in KibanaIn this section, we are going to learn about the working of the Heat Map and creation of the index in the Kibana. Along with this we will also learn how to add data in the Kibana after the creation of the index and how to use the dev tool in Kibana for the creation of the index and addition of the data. Heat Map in KibanaIn order to start we need to create a visualization and for that we need to click on the visualization tab which is present at the left panel of the window. 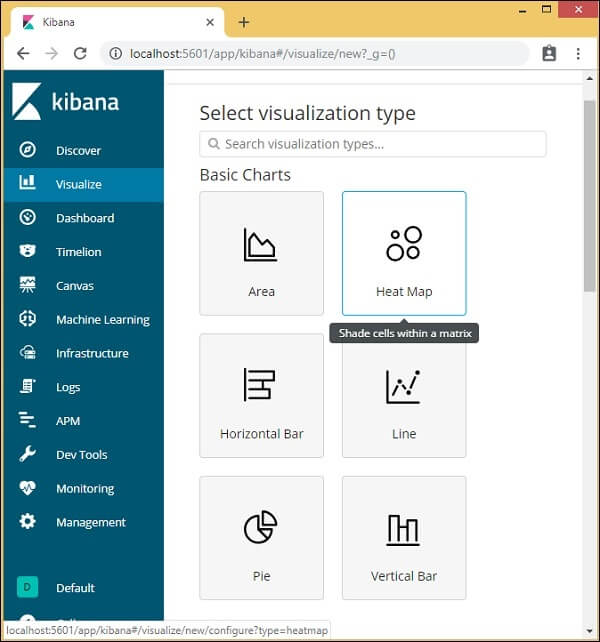
As we can clearly see that in the visualization option there is an option of Heat map. Click on that option and it will further ask us to select the index. As shown above, pick the index countriesdata-28.12.2018. Once the index is selected, as shown below, we have to select the data. Now select the index that you want to work on and in our case, we are going to insert the countries data dated 28.12.2018. After that we need to select the data from the prompt or window that will appear. For the better understanding and reference, you can look at the image below. 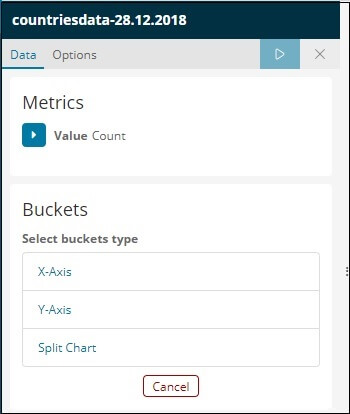
Now after the data is selected, we need to pick up the matrix that we want to work upon. Now here in this option we need to select the type of Aggregation that we want to do on our matrix. Here we will pick the Max aggregation function from the drop-down list. 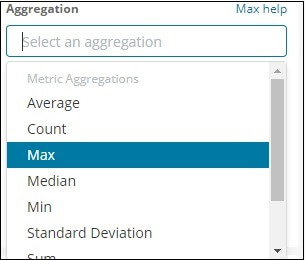
Here because we are interested in plotting the maximum area country wise so that's why we have selected the Max aggregation function. Now next it will ask you to pick the values from the bucket. Here we will go on one by one so now we will pick the X- axis from the list of the bucket. 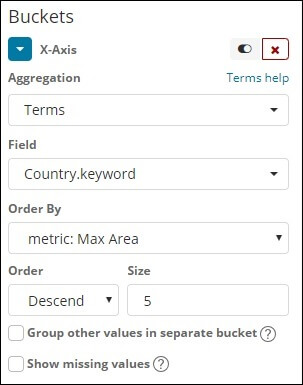
We used Terms of Aggregation, Field as Region, and Order by Max Area. As shown below, click Apply Changes -Now in the fields below in the window we are going to select Terms in Aggregation field, Country keyword in the Field and in order by field matrix max area and in order Descend and size will be 5. 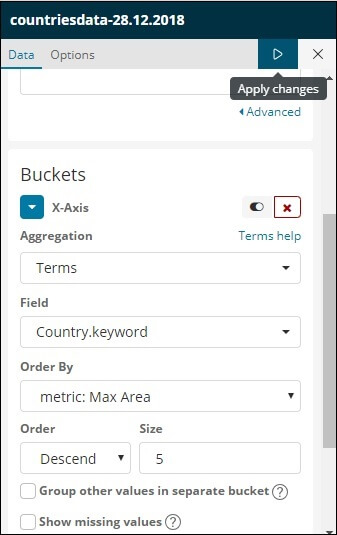
The moment we click on the Add changes button on the window, we will see a map as shown in the fig below. 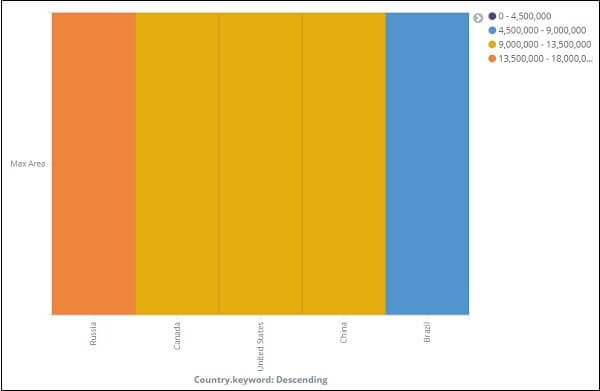
The map displays the various colours and the it also shows the number of areas at the right side of the heat map. Also, if we click on the small color circles present on the right then those colors will reflect on the map. 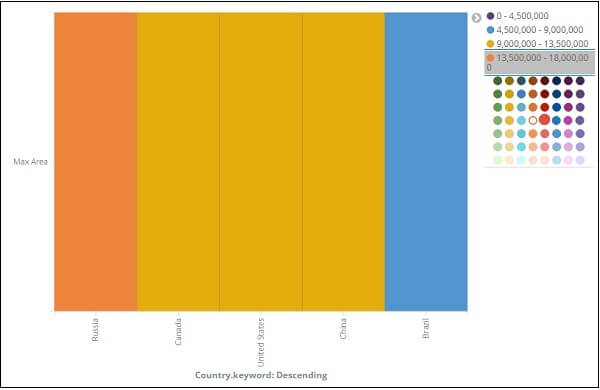
Creation of Map for IndexNow here we are going to use the Geo aggregation function. It is a type of bucket aggregation function that is used for the coordination diagram. The index that we are going to use in this type of map must consist of a geo-point type field which is very necessary for this type of aggregation. The geo point consists of two locations that are latitude and the longitude location point fields. By using the Kibana dev software, we have an option to make an index and also, we can add bulk data to that index as per our need. Here in this example, we are going to add routing and add the sort of geo-point that we need. 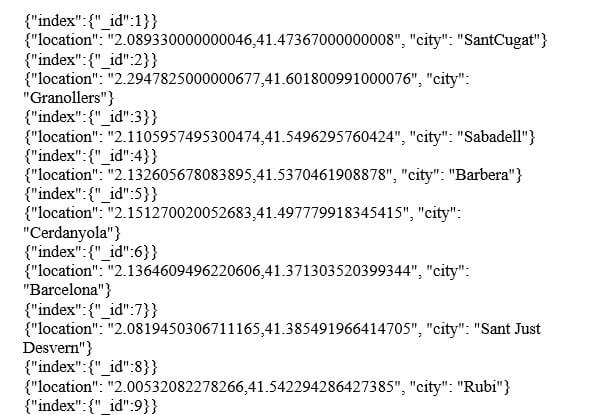
Now we need to run some sort of commands in order to get the desired changes. The code is as follows: For the reference, one can have a look at the image below. 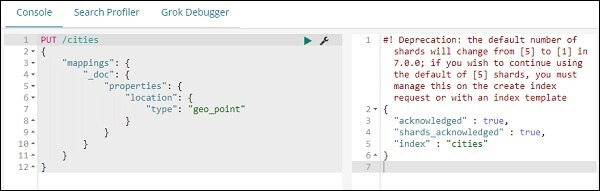
After the command runs successfully, the Index that consists of the name of the cities of type doc are generated by the above command and the field position has its type as the geo point as for the reference, we can see it in the image below. Now let's add some more data to the index that we created by the name of cities. One must make sure before adding the data to any index that, the data that we are going to add in any index must be of the same metadata as previously it has been added to the index. 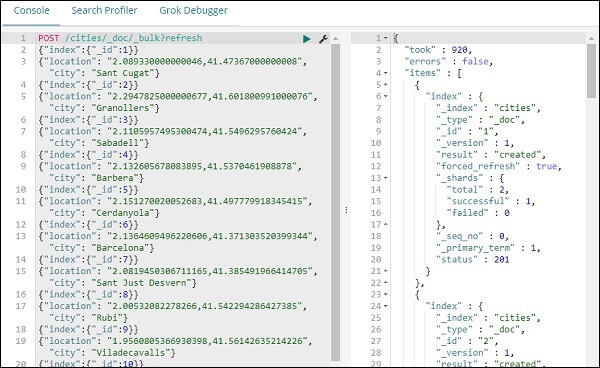
We have finished with data building index name cites. Now, let us use the Management tab to build an index pattern for cities. Now we have successfully created the index and have added the data to it. Now, let us use the Management tab to build an index pattern for cities. 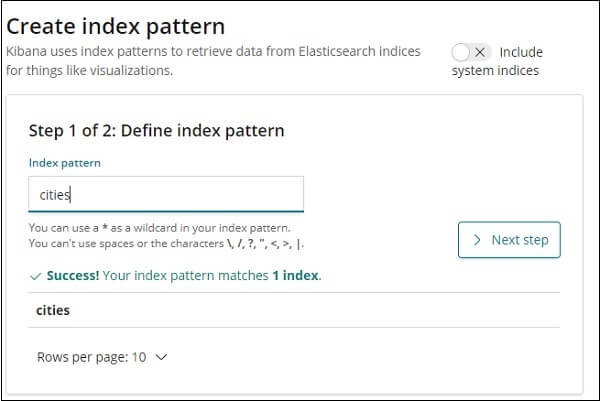
The descriptions of areas within the city index are shown here in the image below. 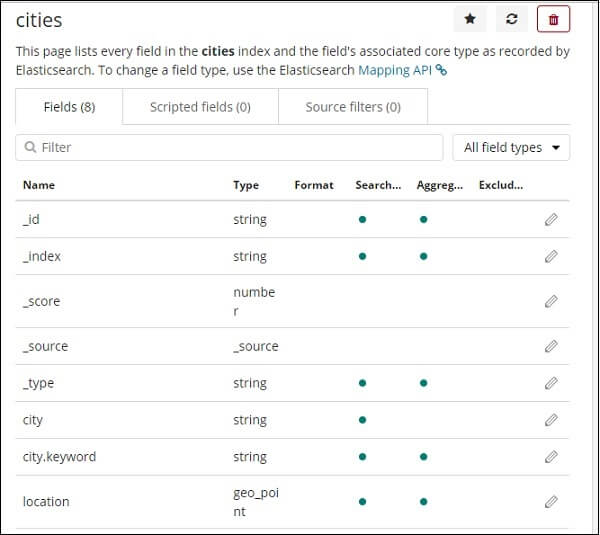
We can see that the form of position is geo-point. We can now use it for visualisation and development purpose.
Next TopicCreation and Working of Region Map
|
 For Videos Join Our Youtube Channel: Join Now
Feedback
- Send your Feedback to [email protected]
Help Others, Please Share


