Difference Between Fundamental Analysis and Technical Analysis
Introduction
Fundamental analysis examines a company's financial and economic fundamentals to determine its worth. This involves investigating the firm's financial accounts, the management team, industry trends, and macroeconomic issues. The purpose is to identify whether the firm is cheap or overpriced and then make appropriate investment decisions.
Technical analysis, on the other hand, is reviewing charts and market data to uncover patterns and trends that might predict future price moves. Looking at historical price and volume data, as well as technical indicators like moving averages, support and resistance levels, and trend lines, is part of this. The idea is to utilize this data to forecast future price fluctuations and base investment decisions on these forecasts.
Fundamental Analysis
The fundamental analysis assesses investments by examining the financial and economic aspects that influence their value. It entails examining the company's financial statements, the industry in which it works, and the more significant economic climate to assess if the investment will be lucrative.
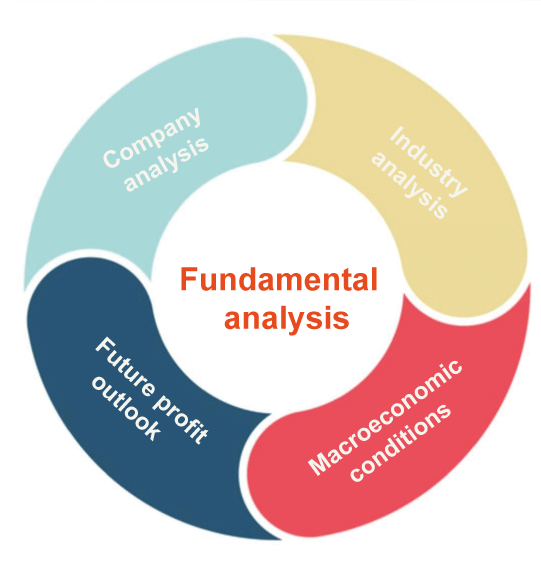
Key Elements of Fundamental Analysis
- Company financial statements: Financial statements for a company comprise the income statement, balance sheet, and cash flow statement. By scrutinizing these documents, investors can learn about the company's income, spending, assets, liabilities, and cash flow.
- Industry analysis: By evaluating the industry in which the firm competes, investors may receive insight into the company's competitive position, growth possibilities, and potential hazards.
- Economic indicators: Fundamental research also includes looking at larger economic indicators like GDP growth, inflation, and interest rates to see how they can affect the company's operations and profitability.
- Management analysis: It assesses the company's management team to identify their track record, experience, and leadership style, as well as their capacity to execute the company's plan.
- Valuation Metrics: Fundamental analysis also includes examining various valuation metrics, such as the price-to-earnings ratio (P/E ratio) and the price-to-book ratio, to determine whether the investment is undervalued or overvalued in comparison to its peers.
Technical analysis
Technical analysis is a technique that uses past price and volume data to analyze securities and make trading choices. It entails examining charts and recognizing patterns to forecast future price changes. Technical analysts think charts include all the information they need to make trading choices, such as trends, support and resistance levels, and indicators.
The fundamental idea of technical analysis is that prices move in trends that repeat themselves over time. By detecting these trends and patterns, technical analysts can forecast where prices will go. They employ numerous tools and approaches to identify these trends and patterns, like moving averages, chart patterns, and indicators.
Support and resistance levels are crucial ideas in technical analysis. Support levels are where buyers often join the market, whereas resistance levels are where sellers typically enter the market. Technical analysts may make informed trading decisions based on the direction of the trend and the strength of the support or resistance level by recognizing key levels on a chart.
Moreover, technical analysis is an effective tool for traders who wish to make informed trading decisions based on previous price and volume data. While there is no certainty that previous trends and patterns will repeat themselves, technical analysis may give useful insights into market movements and assist traders.
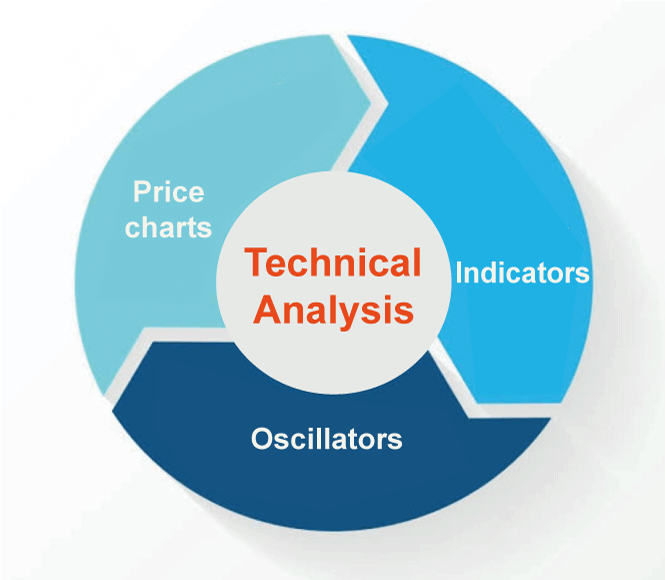
Key Elements of Technical Analysis
- Price: Technical analysis primarily studies a security's price changes over time. The market price represents all available information, including the company's fundamentals, investor mood, and economic considerations.
- Charts: Charts are used by technical analysts to visualize price movements and discover patterns. Depending on the trader's preferences, these charts may be built with several timeframes, such as daily, weekly, or monthly.
- Trends: Technical analysts search for price movement tendencies that may be classified as uptrends, downtrends, or sideways. Trends may be utilized to make trading decisions and forecast price fluctuations in the future.
- Support and resistance: Technical analysts search for support and resistance levels on a chart, which reflects the points at which buyers and sellers join the market. Support levels are those where buying pressure is high, while resistance levels are those where selling pressure is strong.
- Indicators: Indicators like momentum, volume, and volatility are used by technical analysts to give extra information regarding price movements. Moving averages, the relative strength index (RSI), and Bollinger Bands are other common indicators.
- Chart patterns: To detect probable trend reversals or continuations, technical analysts look for patterns such as head and shoulders, triangles, and double tops and bottoms.
- Timeframes: Technical analysis may be used on various timescales, ranging from short-term intraday charts to long-term monthly charts. Traders can use several timescales for different goals, such as spotting short-term trading opportunities or long-term patterns.
Difference Between Fundamental Analysis and Technical Analysis
| Basis of Comparison |
Fundamental Analysis |
Technical Analysis |
| Definition |
A method of analyzing security by evaluating its intrinsic value based on economic, financial, and other qualitative and quantitative factors. |
A method of analyzing security by studying its past market data, such as price and volume, to predict future price movements. |
| Focus |
The company's financial and economic fundamentals include revenue, earnings, management, industry trends, and macroeconomic factors. |
Market trends, charts, and technical indicators include moving averages, support and resistance levels, and momentum indicators. |
| Approach |
Top-down approach: Analyze broader economic and industry trends before analyzing individual companies. |
Bottom-up approach: Analyzes individual securities first, then evaluates market trends and technical indicators. |
| Time horizon |
Long-term perspective: Investors use fundamental analysis to evaluate the long-term growth potential of a company. |
Short-term perspective: Traders use technical analysis to predict short-term price movements and identify trading opportunities. |
| Information source |
Company financial statements, economic reports, industry data, and news events. |
Market data, price charts, trading volumes, and technical indicators. |
| Suitability |
Suitable for investors interested in a company's long-term growth potential and willing to hold the stock for a long time. |
Suitable for traders interested in short-term price movements and willing to buy and sell stocks frequently. |
Key Points to Keep in Mind about Fundamental Analysis
Fundamental analysis evaluates a company's or security's intrinsic value by examining its financial and economic fundamentals, such as revenue, earnings, management, industry trends, and macroeconomic factors. Here are some key points to keep in mind about fundamental analysis:
- Company's financial health: One of the main objectives of fundamental analysis is to evaluate the financial health of a company by analyzing its financial statements, such as balance sheets, income statements, and cash flow statements. This helps investors understand how the company generates revenue, manages its expenses, and generates profits.
- Industry trends: Fundamental analysis also involves analyzing the broader industry trends in which the company operates. This helps investors understand the growth potential and risks associated with the industry and how the company fits into the overall market.
- Macroeconomic factors: The economy and broader economic factors such as interest rates, inflation, and government policies can significantly impact a company's financial performance. Fundamental analysis considers these factors when evaluating a company's intrinsic value.
- Management quality: The quality of a company's management team is also an important consideration in fundamental analysis. Good management can help a company navigate difficult times and achieve long-term success.
- Valuation: Fundamental analysis helps investors determine whether a security is overvalued, undervalued, or fairly valued by comparing its current market price to its intrinsic value. This can help investors make informed decisions about buying or selling a security.
Key Points to Keep in Mind about Technical Analysis
Technical analysis is a method of analyzing securities by studying past market data, such as price and volume, to predict future price movements. Here are some key points about technical analysis in simple and human language:
- Technical analysis is like detective work for stocks: Just like a detective looks for clues to solve a mystery, technical analysts look for patterns and trends in market data to predict where stock prices may go.
- It is all about supply and demand: Technical analysis is based on the idea that the balance between supply and demand in the market determines the price of a stock. By studying market data, technical analysts try to understand the supply and demand forces driving stock prices.
- Charts are the primary tool: Technical analysts use charts to visualize market data and identify patterns and trends. They look for support and resistance levels, trend lines, and chart patterns to help them predict where stock prices may go.
- It is not a crystal ball: While technical analysis can help predict stock price movements, it is not a foolproof method. The market can be unpredictable, and there are no guarantees that past performance will continue.
- It is not just for day traders: While technical analysis is often associated with short-term trading, it can also be used by long-term investors to make informed decisions about buying and selling stocks.
- Emotions can influence the market: Technical analysts recognize that market sentiment and emotions drive stock prices. By understanding these factors, they can make more informed decisions about when to buy and sell stocks.
- It takes practice and skill: Technical analysis is a skill that takes time and practice to develop, and it requires a deep understanding of market data and interpreting it meaningfully.
|

 For Videos Join Our Youtube Channel: Join Now


