Data Science Tutorial for Beginners

Data Science has become the most demanding job of the 21st century. Every organization is looking for candidates with knowledge of data science. In this tutorial, we are giving an introduction to data science, with data science Job roles, tools for data science, components of data science, application, etc.

So let's start,

Data Science tutorial

What is Data Science?

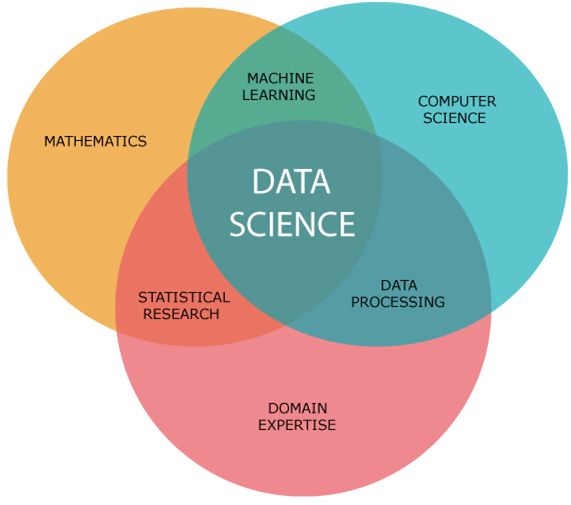
Data Science is a multidisciplinary field that involves the use of statistical and computational methods to extract insights and knowledge from data. To analyze and comprehend large data sets, it uses techniques from computer science, mathematics, and statistics.

Data mining, machine learning, and data visualization are just a few of the tools and methods we frequently employ to draw meaning from data. They may deal with both structured and unstructured data, including text and pictures, databases, and spreadsheets.

A number of sectors, including healthcare, finance, marketing, and more, use the insights and experience gained via data analysis to steer innovation, advise business decisions, and address challenging problems.

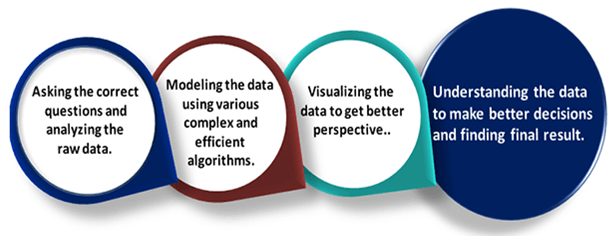
In short, we can say that data science is all about:
  • Collecting data from a range of sources, including databases, sensors, websites, etc.
  • Making sure data is in a format that can be analyzed while also organizing and processing it to remove mistakes and inconsistencies.
  • Finding patterns and correlations in the data using statistical and machine learning approaches.
  • Developing visual representations of the data to aid in comprehension of the conclusions and insights.
  • Creating mathematical models and computer programs that can classify and forecast based on data.
  • Conveying clear and understandable facts and insights to others.

Example:

Let's suppose we want to travel from station A to staztion B by car. Now, we need to make some decisions such as which route will be the best route to reach faster at the location, in which route there will be no traffic jam, and which will be cost-effective. All these decision factors will act as input data, and we will get an appropriate answer from these decisions, so this analysis of data is called the data analysis, which is a part of data science.


Need for Data Science:
Data Science tutorial

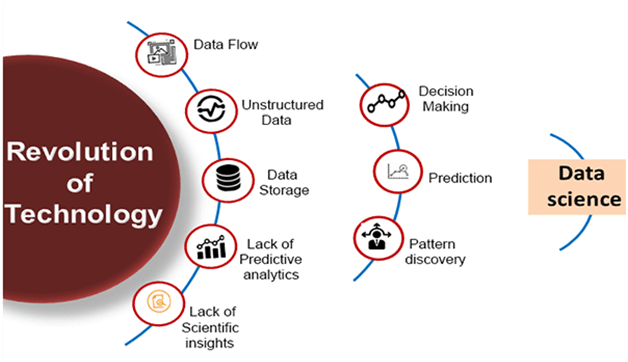
Some years ago, data was less and mostly available in a structured form, which could be easily stored in excel sheets, and processed using BI tools.

But in today's world, data is becoming so vast, i.e., approximately 2.5 quintals bytes of data is generating on every day, which led to data explosion. It is estimated as per researches, that by 2020, 1.7 MB of data will be created at every single second, by a single person on earth. Every Company requires data to work, grow, and improve their businesses.

Now, handling of such huge amount of data is a challenging task for every organization. So to handle, process, and analysis of this, we required some complex, powerful, and efficient algorithms and technology, and that technology came into existence as data Science. Following are some main reasons for using data science technology:

  • Every day, the world produces enormous volumes of data, which must be processed and analysed by data scientists in order to provide new information and understanding.
  • To maintain their competitiveness in their respective industries, businesses and organizations must make data-driven choices. Data science offers the methods and tools needed to harvest valuable information from data in order to help decision-making.
  • In many disciplines, including healthcare, economics, and climate research, data science is essential for finding solutions to complicated issues.
  • Data science is now crucial for creating and educating intelligent systems as artificial intelligence and machine learning have grown in popularity.
  • Data science increases productivity and lowers costs in a variety of industries, including manufacturing and logistics, by streamlining procedures and forecasting results.

Data science Jobs:

As per various surveys, data scientist job is becoming the most demanding Job of the 21st century due to increasing demands for data science. Some people also called it "the hottest job title of the 21st century". Data scientists are the experts who can use various statistical tools and machine learning algorithms to understand and analyze the data.

The average salary range for data scientist will be approximately $95,000 to $ 165,000 per annum, and as per different researches, about 11.5 millions of job will be created by the year 2026.

Types of Data Science Job

If you learn data science, then you get the opportunity to find the various exciting job roles in this domain. The main job roles are given below:

  1. Data Scientist
  2. Data Analyst
  3. Machine learning expert
  4. Data engineer
  5. Data Architect
  6. Data Administrator
  7. Business Analyst
  8. Business Intelligence Manager

1. Data Scientist: A data scientist is in charge of deciphering large, complicated data sets for patterns and trends, as well as creating prediction models that may be applied to business choices. They could also be in charge of creating data-driven solutions for certain business issues.

Skill Required: To become a data scientist, one needs skills in mathematics, statistics, programming languages(such as Python, R, and Julia), Machine Learning, Data Visualisation, Big Data Technologies (such as Hadoop), domain expertise( such that the person is capable of understanding data which is related to the domain), and communication and presentation skills to efficiently convey the insights from the data.

2. Machine Learning Engineer: A machine learning engineer is in charge of creating, testing, and implementing machine learning algorithms and models that may be utilized to automate tasks and boost productivity.

Skill Required: Programming languages like Python and Java, statistics, machine learning frameworks like TensorFlow and PyTorch, big data technologies like Hadoop and Spark, software engineering, and problem-solving skills are all necessary for a machine learning engineer.

3. Data Analyst: Data analysts are in charge of gathering and examining data in order to spot patterns and trends and offer insights that may be applied to guide business choices. Creating data visualizations and reports to present results to stakeholders may also fall within the scope of their responsibility.

Skill Required: Data analysis and visualization, statistical analysis, database querying, programming in languages like SQL or Python, critical thinking, and familiarity with tools and technologies like Excel, Tableau, SQL Server, and Jupyter Notebook are all necessary for a data analyst.

4. Business Intelligence Analyst: Data analysis for business development and improvement is the responsibility of a business intelligence analyst. They could also be in charge of developing and putting into use data warehouses and other types of data management systems.

Skill Required: A business intelligence analyst has to be skilled in data analysis and visualization, business knowledge, SQL and data warehousing, data modeling, and ETL procedures, as well as programming languages like Python and knowledge of BI tools like Tableau, Power BI, or QlikView.

5. Data Engineer: A data engineer is in charge of creating, constructing, and maintaining the infrastructure and pipelines for collecting and storing data from diverse sources. In addition to guaranteeing data security and quality, they could also be in charge of creating data integration solutions.

Skill Required: To create, build, and maintain scalable and effective data pipelines and data infrastructure for processing and storing large volumes of data, a data engineer needs expertise in database architecture, ETL procedures, data modeling, programming languages like Python and SQL, big data technologies like Hadoop and Spark, cloud computing platforms like AWS or Azure, and tools like Apache Airflow or Talend.

6. Big Data Engineer: Big data engineers are in charge of planning and constructing systems that can handle and analyze massive volumes of data. Additionally, they can be in charge of putting scalable data storage options into place and creating distributed computing systems.

Skilled Required: Big Data Engineers must be proficient in distributed systems, programming languages like Java or Scala, data modeling, database management, cloud computing platforms like AWS or Azure, big data technologies like Apache Spark, Kafka, and Hive, and experience with tools like Apache NiFi or Apache Beam in order to design, build, and maintain large-scale distributed data processing systems for hand.

7. Data Architect: Data models and database systems that can support data-intensive applications must be designed and implemented by a data architect. They could also be in charge of maintaining data security, privacy, and compliance.

Skill Required: A data architect needs knowledge of database design and modeling, data warehousing, ETL procedures, programming languages like SQL or Python, proficiency with data modeling tools like ER/Studio or ERwin, familiarity with cloud computing platforms like AWS or Azure, and expertise in data governance and security.

8. Data Administrator: An organization's data assets must be managed and organized by a data administrator. They are in charge of guaranteeing the security, accuracy, and completeness of data as well as making sure that those who require it can readily access it.

Skill Required: A data administrator needs expertise in database management, backup, and recovery, data security, SQL programming, data modeling, familiarity with database platforms like Oracle or SQL Server, proficiency with data management tools like SQL Developer or Toad, and experience with cloud computing platforms like AWS or Azure.

9. Business Analyst: A business analyst is a professional who helps organizations identify business problems and opportunities and recommends solutions to those problems through the use of data and analysis.

Skill Required: A business analyst needs expertise in data analysis, business process modeling, stakeholder management, requirements gathering and documentation, proficiency in tools like Excel, Power BI, or Tableau, and experience with project management.


Prerequisite for Data Science

Non-Technical Prerequisite:

While technical skills are essential for data science, there are also non-technical skills that are important for success in this field. Here are some non-technical prerequisites for data science:

  1. Domain knowledge: To succeed in data science, it might be essential to have a thorough grasp of the sector or area you are working in. Your understanding of the data and its importance to the business will improve as a result of this information.
  2. Problem-solving skills: Solving complicated issues is a common part of data science, thus, the capacity to do it methodically and systematically is crucial.
  3. Communication skills: Data scientists need to be good communicators. You must be able to communicate the insights to others.
  4. Curiosity and creativity: Data science frequently entails venturing into unfamiliar territory, so being able to think creatively and approach issues from several perspectives may be a significant skill.
  5. Business Acumen: For data scientists, it is crucial to comprehend how organizations function and create value. This aids in improving your comprehension of the context and applicability of your work as well as pointing up potential uses of data to produce commercial results.
  6. Critical thinking: In data science, it's critical to be able to assess information with objectivity and reach logical conclusions. This involves the capacity to spot biases and assumptions in data and analysis as well as the capacity to form reasonable conclusions based on the facts at hand.

Technical Prerequisite:

Since data science includes dealing with enormous volumes of data and necessitates a thorough understanding of statistical analysis, machine learning algorithms, and programming languages, technical skills are crucial. Here are some technical prerequisites for data science:

  1. Mathematics and Statistics: Data science is working with data and analyzing it using statistical methods. As a result, you should have a strong background in statistics and mathematics. Calculus, linear algebra, probability theory, and statistical inference are some of the important ideas you should be familiar with.
  2. Programming: A fundamental skill for data scientists is programming. A solid command of at least one programming language, such as Python, R, or SQL, is required. Additionally, you must be knowledgeable about well-known data science libraries like Pandas, NumPy, and Matplotlib.
  3. Data Manipulation and Analysis: Working with data is an important component of data science. You should be skilled in methods for cleaning, transforming, and analyzing data, as well as in data visualization. Knowledge of programs like Tableau or Power BI might be helpful.
  4. Machine Learning: A key component of data science is machine learning. Decision trees, random forests, and clustering are a few examples of supervised and unsupervised learning algorithms that you should be well-versed in. Additionally, you should be familiar with well-known machine learning frameworks like Scikit-learn and TensorFlow.
  5. Deep Learning: Neural networks are used in deep learning, a kind of machine learning. Deep learning frameworks like TensorFlow, PyTorch, or Keras should be familiar to you.
  6. Big Data Technologies: Large and intricate datasets are a common tool used by data scientists. Big data technologies like Hadoop, Spark, and Hive should be known to you.
  7. Databases: The depth of understanding of Databases, such as SQL, is essential for data science to get the data and to work with data.

Difference between BI and Data Science

BI stands for business intelligence, which is also used for data analysis of business information: Below are some differences between BI and Data sciences:

CriterionBusiness intelligenceData science
Data SourceBusiness intelligence deals with structured data, e.g., data warehouse.Data science deals with structured and unstructured data, e.g., weblogs, feedback, etc.
MethodAnalytical(historical data)Scientific(goes deeper to know the reason for the data report)
SkillsStatistics and Visualization are the two skills required for business intelligence.Statistics, Visualization, and Machine learning are the required skills for data science.
FocusBusiness intelligence focuses on both Past and present dataData science focuses on past data, present data, and also future predictions.

Data Science Components:

Data Science tutorial

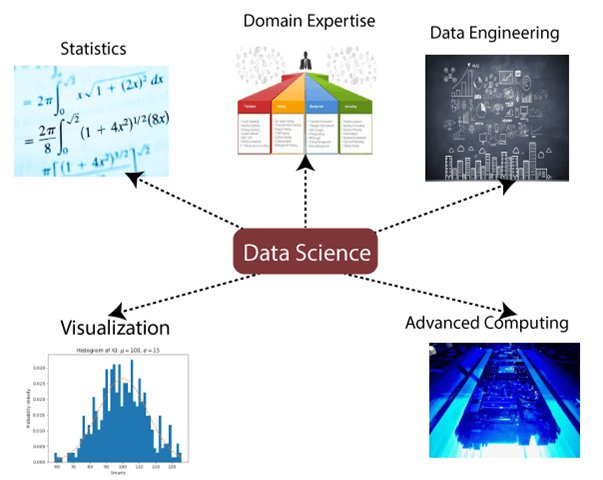
Data science involves several components that work together to extract insights and value from data. Here are some of the key components of data science:

  1. Statistics: Statistics is one of the most important components of data science. Statistics is a way to collect and analyze numerical data in a large amount and find meaningful insights from it.
  2. Mathematics: Mathematics is a critical part of data science. Mathematics involves the study of quantity, structure, space, and changes. For a data scientist, knowledge of good mathematics is essential.
  3. Domain Expertise: In data science, domain expertise binds data science together. Domain expertise means specialized knowledge or skills in a particular area. In data science, there are various areas for which we need domain experts.
  4. Data Collection: Data is gathered and acquired from a number of sources. This can be unstructured data from social media, text, or photographs, as well as structured data from databases.
  5. Data Preprocessing: Raw data is frequently unreliable, erratic, or incomplete. In order to remove mistakes, handle missing data, and standardize the data, data cleaning and preprocessing is a crucial steps.
  6. Data Exploration and Visualization: This entails exploring the data and gaining insights using methods like statistical analysis and data visualization. To aid in understanding the data, this may entail developing graphs, charts, and dashboards.
  7. Data Modeling: In order to analyze the data and derive insights, this component entails creating models and algorithms. Regression, classification, and clustering are a few examples of supervised and unsupervised learning techniques that may be used in this.
  8. Machine Learning: Building predictive models that can learn from data is required for this. This might include the increasingly significant deep learning methods, such as neural networks, in data science.
  9. Communication: This entails informing stakeholders of the data analysis's findings. Explain the results, and this might involve producing reports, visualizations, and presentations.
  10. Deployment and Maintenance: The models and algorithms need to be deployed and maintained when the data science project is over. This may entail keeping an eye on the models' performance and upgrading them as necessary.
Data Science tutorial

Tools for Data Science

Following are some tools required for data science:

  • Data Analysis tools: R, Python, Statistics, SAS, Jupyter, R Studio, MATLAB, Excel, RapidMiner.
  • Data Warehousing: ETL, SQL, Hadoop, Informatica/Talend, AWS Redshift
  • Data Visualization tools: R, Jupyter, Tableau, Cognos.
  • Machine learning tools: Spark, Mahout, Azure ML studio.

Machine learning in Data Science

To become a data scientist, one should also be aware of machine learning and its algorithms, as in data science, there are various machine learning algorithms which are broadly being used. Following are the name of some machine learning algorithms used in data science:

  • Regression
  • Decision tree
  • Clustering
  • Principal component analysis
  • Support vector machines
  • Naive Bayes
  • Artificial neural network
  • Apriori

We will provide you some brief introduction for few of the important algorithms here,

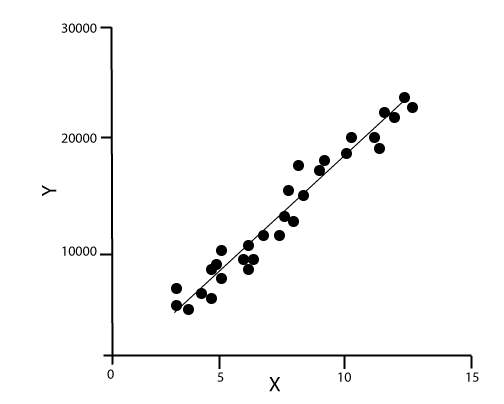
1. Linear Regression Algorithm: Linear regression is the most popular machine learning algorithm based on supervised learning. This algorithm work on regression, which is a method of modeling target values based on independent variables. It represents the form of the linear equation, which has a relationship between the set of inputs and predictive output. This algorithm is mostly used in forecasting and predictions. Since it shows the linear relationship between input and output variable, hence it is called linear regression.
Data Science tutorial

The below equation can describe the relationship between x and y variables:

Where, y= Dependent variable
X= independent variable
M= slope
C= intercept.

2. Decision Tree: Decision Tree algorithm is another machine learning algorithm, which belongs to the supervised learning algorithm. This is one of the most popular machine learning algorithms. It can be used for both classification and regression problems.

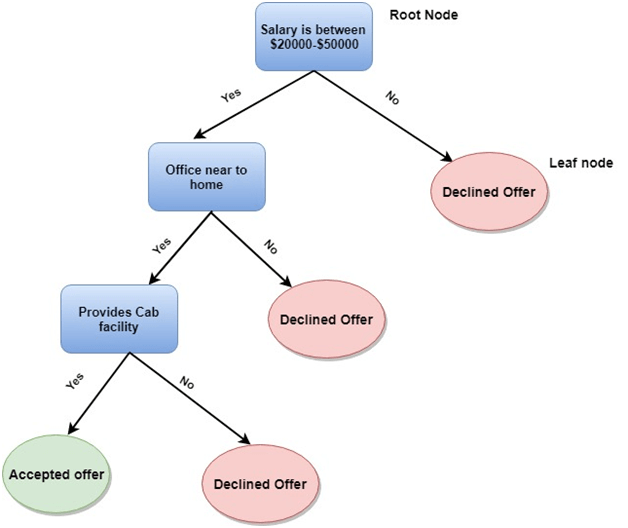
In the decision tree algorithm, we can solve the problem, by using tree representation in which, each node represents a feature, each branch represents a decision, and each leaf represents the outcome.

Following is the example for a Job offer problem:
Data Science tutorial

In the decision tree, we start from the root of the tree and compare the values of the root attribute with record attribute. On the basis of this comparison, we follow the branch as per the value and then move to the next node. We continue comparing these values until we reach the leaf node with predicated class value.

3. K-Means Clustering: K-means clustering is one of the most popular algorithms of machine learning, which belongs to the unsupervised learning algorithm. It solves the clustering problem.

If we are given a data set of items, with certain features and values, and we need to categorize those set of items into groups, so such type of problems can be solved using k-means clustering algorithm.

K-means clustering algorithm aims at minimizing an objective function, which known as squared error function, and it is given as:

Data Science tutorial

Where, J(V) => Objective function
'||xi - vj||' => Euclidean distance between xi and vj.
ci' => Number of data points in ith cluster.
C => Number of clusters.

4. SVM: The supervised learning technique known as SVM, or support vector machine, is used for regression and classification. The fundamental principle of SVM is to identify the hyperplane in a high-dimensional space that best discriminates between the various classes of data.

SVM, to put it simply, seeks to identify a decision boundary that maximizes the margin between the two classes of data. The margin is the separation of each class's nearest data points, known as support vectors, from the hyperplane.

The use of various kernel types that translate the input data to a higher-dimensional space where it may be linearly separated allows SVM to be used for both linearly separable and non-linearly separable data.

Data Science tutorial

Among the various uses for SVM are bioinformatics, text classification, and picture classification. Due to its strong performance and theoretical assurances, it has been widely employed in both industry and academic studies.

5. KNN: The supervised learning technique known as KNN, or k-Nearest Neighbours, is used for regression and classification. The fundamental goal of KNN is to categorize a data point by selecting the class that appears most frequently among the "k" nearest labeled data points in the feature space.

Simply said, KNN is a lazy learning method that saves all training data points in memory and uses them for classification or regression whenever a new data point is provided, rather than developing a model manually.

The value of "k" indicates how many neighbors should be taken into account for classification when using KNN, which may be utilized for both classification and regression issues. A smoother choice boundary will be produced by a bigger value of "k," whereas a more complicated decision boundary will be produced by a lower value of "k".

Data Science tutorial

There are several uses for KNN, including recommendation systems, text classification, and picture classification. Due to its efficacy and simplicity, it has been extensively employed in both academic and industrial research. When working with big datasets can be computationally costly and necessitates the careful selection of the value of "k" and the distance metric employed to determine the separation between data points.

6. Naive Bayes: A supervised learning method used for classification and regression analysis is called Naive Bayes. It is founded on the Bayes theorem, a probability theory that determines the likelihood of a hypothesis in light of the data currently available.

The term "naive" refers to the assumption made by Naive Bayes, which is that the existence of one feature in a class is unrelated to the presence of any other features in that class. This presumption makes conditional probability computation easier and increases the algorithm's computing efficiency.

Naive Bayes utilizes the Bayes theorem to determine the likelihood of each class given a collection of input characteristics for binary and multi-class classification problems. The projected class for the input data is then determined by selecting the class with the highest probability.

Naive Bayes has several uses, including document categorization, sentiment analysis, and email spam screening. Due to its ease of use, effectiveness, and strong performance across a wide range of activities, it has received extensive use in both academic research and industry. However, it could not be effective for complicated issues in which the independence assumption is violated.

7. Random Forest: A supervised learning system called Random Forest is utilized for regression and classification. It is an ensemble learning technique that mixes various decision trees to increase the model's robustness and accuracy.

Simply said, Random Forest builds a number of decision trees using randomly chosen portions of the training data and features, combining the results to provide a final prediction. The characteristics and data used to construct each decision tree in the Random Forest are chosen at random, and each tree is trained independently of the others.

Both classification and regression issues may be solved with Random Forest, which is renowned for its excellent accuracy, resilience, and resistance to overfitting. It may be used for feature selection and ranking and can handle huge datasets with high dimensionality and missing values.

Data Science tutorial

There are several uses for Random Forest, including bioinformatics, text classification, and picture classification. Due to its strong performance and capacity for handling complicated issues, it has been widely employed in both academic research and industry. For issues involving strongly linked traits or class inequalities, it might not be very effective.

8. Logistic Regression: For binary classification issues, where the objective is to predict the likelihood of a binary result (such as Yes/No, True/False, or 1/0), logistic regression is a form of supervised learning technique. It is a statistical model that converts the result of a linear regression model into a probability value between 0 and 1. It does this by using the logistic function.

Simply expressed, logistic functions are used in logistic regression to represent the connection between the input characteristics and the output probability. Any input value is converted by the logistic function to a probability value between 0 and 1. Given the input attributes, this probability number indicates the possibility that the binary result will be 1.

Both basic and difficult issues may be solved using logistic regression, which can handle input characteristics with both numerical and categorical data. It may be used for feature selection and ranking since it is computationally efficient and simple to understand.

Data Science tutorial

How to solve a problem in Data Science using Machine learning algorithms?

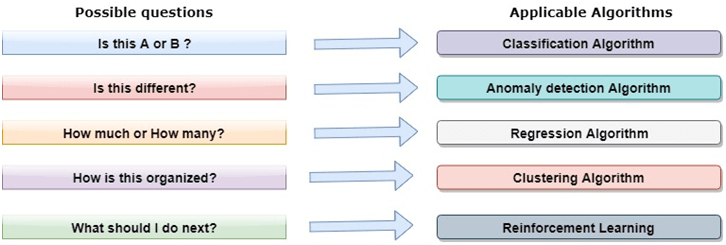
Now, let's understand what are the most common types of problems occurred in data science and what is the approach to solving the problems. So in data science, problems are solved using algorithms, and below is the diagram representation for applicable algorithms for possible questions:
Data Science tutorial

Is this A or B? :

We can refer to this type of problem which has only two fixed solutions such as Yes or No, 1 or 0, may or may not. And this type of problems can be solved using classification algorithms.

Is this different? :

We can refer to this type of question which belongs to various patterns, and we need to find odd from them. Such type of problems can be solved using Anomaly Detection Algorithms.

How much or how many?

The other type of problem occurs which ask for numerical values or figures such as what is the time today, what will be the temperature today, can be solved using regression algorithms.

How is this organized?

Now if you have a problem which needs to deal with the organization of data, then it can be solved using clustering algorithms.

Clustering algorithm organizes and groups the data based on features, colors, or other common characteristics.


Data Science Lifecycle

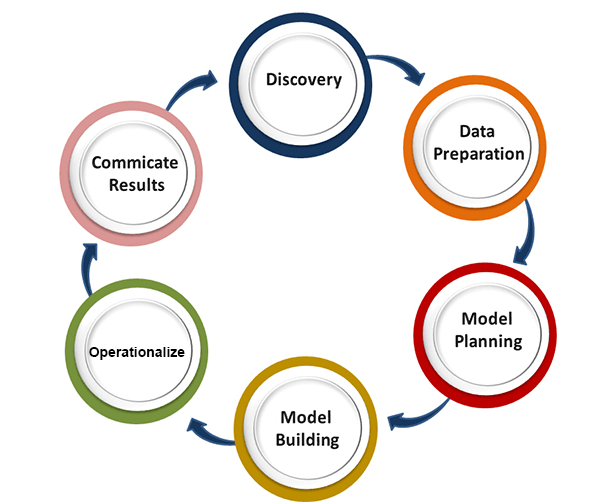
The life-cycle of data science is explained as below diagram.
Data Science tutorial

The main phases of data science life cycle are given below:

1. Discovery: The first phase is discovery, which involves asking the right questions. When you start any data science project, you need to determine what are the basic requirements, priorities, and project budget. In this phase, we need to determine all the requirements of the project such as the number of people, technology, time, data, an end goal, and then we can frame the business problem on first hypothesis level.

2. Data preparation: Data preparation is also known as Data Munging. In this phase, we need to perform the following tasks:

  • Data cleaning
  • Data Reduction
  • Data integration
  • Data transformation,

After performing all the above tasks, we can easily use this data for our further processes.

3. Model Planning: In this phase, we need to determine the various methods and techniques to establish the relation between input variables. We will apply Exploratory data analytics(EDA) by using various statistical formula and visualization tools to understand the relations between variable and to see what data can inform us. Common tools used for model planning are:

  • SQL Analysis Services
  • R
  • SAS
  • Python

4. Model-building: In this phase, the process of model building starts. We will create datasets for training and testing purpose. We will apply different techniques such as association, classification, and clustering, to build the model.

Following are some common Model building tools:

  • SAS Enterprise Miner
  • WEKA
  • SPCS Modeler
  • MATLAB

5. Operationalize: In this phase, we will deliver the final reports of the project, along with briefings, code, and technical documents. This phase provides you a clear overview of complete project performance and other components on a small scale before the full deployment.

6. Communicate results: In this phase, we will check if we reach the goal, which we have set on the initial phase. We will communicate the findings and final result with the business team.


Applications of Data Science:

  • Image recognition and speech recognition:
    Data science is currently using for Image and speech recognition. When you upload an image on Facebook and start getting the suggestion to tag to your friends. This automatic tagging suggestion uses image recognition algorithm, which is part of data science.
    When you say something using, "Ok Google, Siri, Cortana", etc., and these devices respond as per voice control, so this is possible with speech recognition algorithm.
  • Gaming world:
    In the gaming world, the use of Machine learning algorithms is increasing day by day. EA Sports, Sony, Nintendo, are widely using data science for enhancing user experience.
  • Internet search:
    When we want to search for something on the internet, then we use different types of search engines such as Google, Yahoo, Bing, Ask, etc. All these search engines use the data science technology to make the search experience better, and you can get a search result with a fraction of seconds.
  • Transport:
    Transport industries also using data science technology to create self-driving cars. With self-driving cars, it will be easy to reduce the number of road accidents.
  • Healthcare:
    In the healthcare sector, data science is providing lots of benefits. Data science is being used for tumor detection, drug discovery, medical image analysis, virtual medical bots, etc.
  • Recommendation systems:
    Most of the companies, such as Amazon, Netflix, Google Play, etc., are using data science technology for making a better user experience with personalized recommendations. Such as, when you search for something on Amazon, and you started getting suggestions for similar products, so this is because of data science technology.
  • Risk detection:
    Finance industries always had an issue of fraud and risk of losses, but with the help of data science, this can be rescued.
    Most of the finance companies are looking for the data scientist to avoid risk and any type of losses with an increase in customer satisfaction.