| |

Difference Between Mean and MedianMathematics frequently makes use of terms such as mean and median. Mean is similar to an average of a particular number. The Mean is calculated by putting all the numbers together and dividing the result by the total number of digits. However, the median delivers, if ever, the median value from the whole data collection. 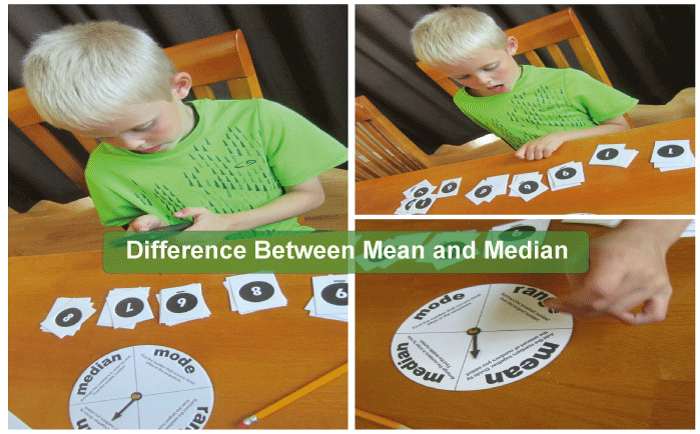
The median is calculated by combining the two intermediate values and dividing the result by two. The three average metrics of mean, median, and mode illustrate how much the data differs from the Mean or the average. These approaches are frequently employed in statistics, with the data mean value approach being the most popular. Mean of Definition
The Mean is calculated by dividing the total number of observations in the collection by the total number of all the data points. When discussing the mean or average height of a group of five people, for instance, we would total the five individuals' heights and divide that amount by five to get at the Mean. Utilizing statistics is one of the most widely used methods of measuring a central pattern. The mean value in a data collection is determined by dividing the total number of values by the aggregate of all the values in the data collection.
The Formula for the Mean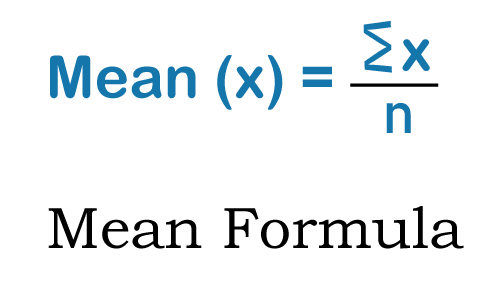
The average number of observations is calculated by dividing the total observations by their aggregate. It will be useful in resolving a majority of arithmetic mean-related problems. It is possible to describe the mean formula of the provided observations as, Formula for the Mean = (Sum of Observations) ÷(Total Numbers of Observations) We also have a mean formula for data that has been grouped. This is written as x? = Σ fx/N where,
Type of Mean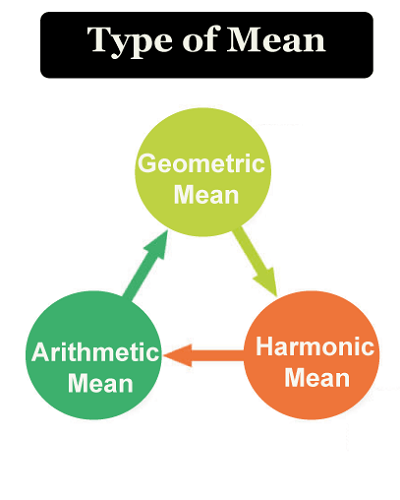
There are three main categories in which Mean can be categorized
Depending on the circumstances or problem presented, Statistics will use a different formula to calculate these three means. 1. Geometric Mean (GM) The average number calculated by taking the nth root of the product of the n values in the data collection is the geometric mean. It's a term used to describe proportionate growth. 2. Arithmetic Mean (AM) Common names for arithmetic Mean include Mean, simply an arithmetic average. All observations added together and divided by all observations equals the arithmetic mean. 3. Harmonic Mean (HM) The harmonic Mean is the opposite of the numerical mean of the reciprocals. Median of Definition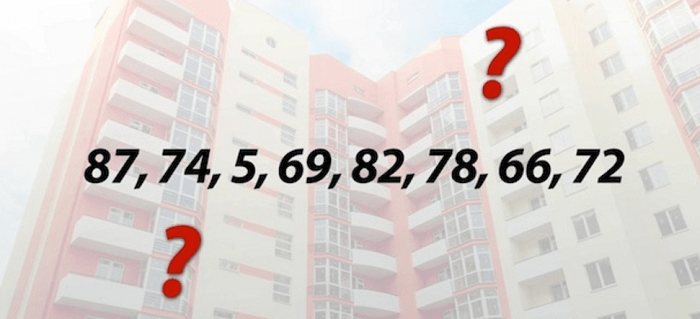
The median value in the data array set, known as the median, distinguishes the higher collection of data from the lower stage. Consequently, the data must be organized in ascending order before computing the median. The Mean of the middle two digits in the data set must be determined once the data set has cardinality. However, these two techniques are frequently applied in combination. The median, together with the Mean and mode, is one of three measurements of central tendency.
The Formula for the Median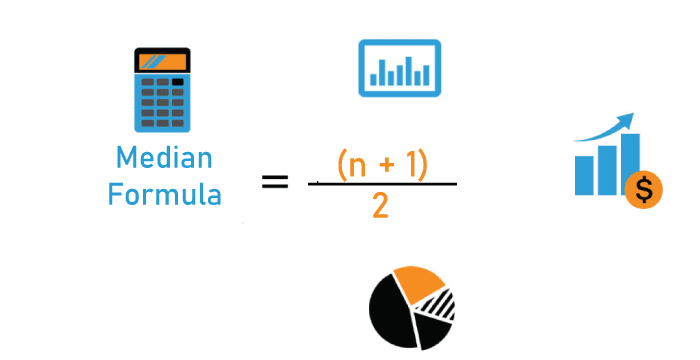
For the median to be computed, the data must be arranged in increasing or decreasing order. Obtain the total number of observations in the data after organizing it. If the number is odd, the median equals (n+1)/2. If the integer is even, the two center values can be obtained using n/2 and (n/2) + 1. These two central words should be averaged out. The median method is presented below for even numbers. 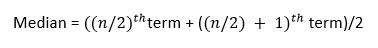
Difference Between Mean and Median
Properties of Mean and Median
Mean's Properties
Median's Properties
Use the MeanWhen both of the following circumstances are met, the mean is applied 1. Data is scaled Weight, height, temperature, and speed are examples of data with regular intervals. 2. Distribution is normal Since the mean is susceptible to outliers in skewed distributions, you should only use it when the distribution is generally normal. Use the MedianWhen one of two requirements is met, the median is utilized. When the
ConclusionThe mode is an additional metric frequently employed to measure central tendency in addition to the mean and median. Using the three data collection techniques, an intelligent analyst will measure the central tendency. The analyses' discrepancies should be carefully studied for the data set to produce better and more accurate findings. Even though the mode and median perform better analyses and discover better results than the mean, the mean is still the most appropriate indicator of central tendency, especially if the data set has a normal distribution and the data are typically skewed.
Next TopicDifference between
|
 For Videos Join Our Youtube Channel: Join Now
Feedback
- Send your Feedback to [email protected]
Help Others, Please Share


