| |

Behavioural Model in Software EngineeringWe will discuss the behavioural model in software engineering in this article. The behavioural model is used to illustrate the dynamic behaviour of the system at the time when the model is executing. The behavioural model depicts what occurs or what should occur when a system reacts to a stimulus from its environment. There are predominantly two kinds of stimuli that fall under behavioural models: data and event.
Two kinds of behavioural models explain the system's behaviour in software engineering. The two models are the data processing model and the state machine model.
Data Flow Diagrams (DFDs)These Diagrams are also called bubble charts. It is used to represent the flow of data through the system. It is a graphical tool for communicating with users, managers, etc. It is a simple technique that assists in analyzing the proposed system. It illustrates the movement of data between external entities & processes and between databases & processes. Any software you use has many pages, such as a login page, home page, etc. As the user moves from one page to another, it is not only the user moving but data flowing from one module to another. When all these things are represented graphically, it is called a data flow diagram. DFD Elements
Symbols Used in DFD are Shown in the Chart Below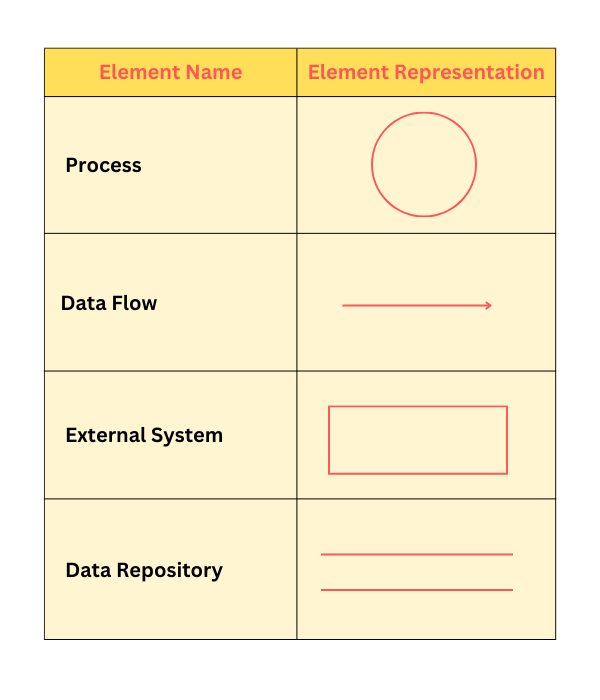
Rules of Data Flow:
Levelling in DFD:DFDs can be drawn to show the system at different levels. Initial or higher levels are divided into lower levels containing more information and functional detail. Level 0 DFD: It is also called a fundamental system model or context diagram. It shows the whole system as a single bubble with input and output data symbolized by incoming and outgoing arrows. Level 0 DFD is divided into multiple bubbles, and each bubble is then divided into more detailed DFDs. Example: You can see the diagram below that shows Level 0 DFD for the Airline Reservation System. 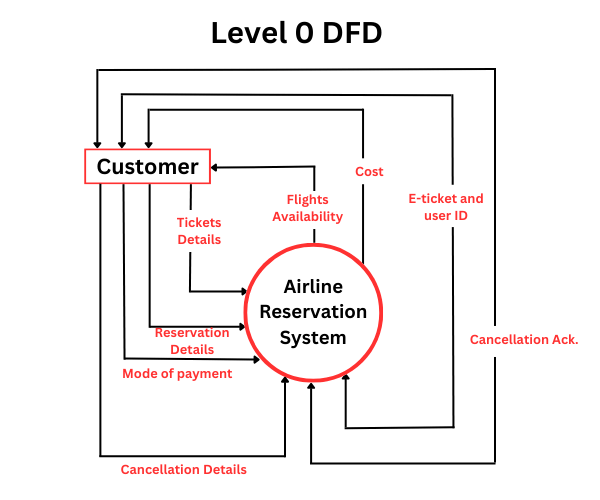
It represents the entire reservation system using a single bubble. As we go forward, we will refine this DFD and the single bubble will be divided into multiple bubbles. Each bubble will represent a separate module; these bubbles will transform data. Level 1 DFD: When Level 0 is refined, the single bubble is divided into multiple bubbles. Example: You can see in the diagram below that a single bubble in the Airline Reservation System is divided into many bubbles. 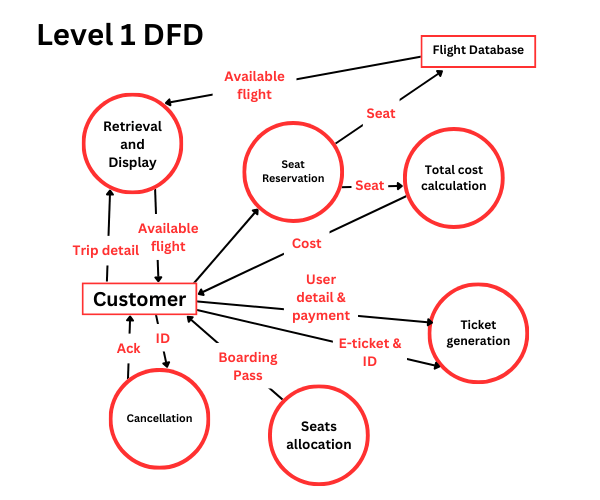
First, data is received from the flight database and displayed to the external entity, the customer. There is a cancellation module where cancellation details are entered, and cancellation acknowledgement is attained. The seat reservation module shows that customers are reserving their seats. The seat reservation module interacts with the total cost calculation module, where the customer is given the total cost of the ticket. The ticket generation module generates the ticket after payment is done by the customer. The seat allocation module shows the boarding pass generation. These are the major processes in Level 1 DFD. Level 2 DFD Each process or module is refined at this level. Example: We can refine each module of the Airline Reservation System, but in this example, we will refine the "Reservation Module". 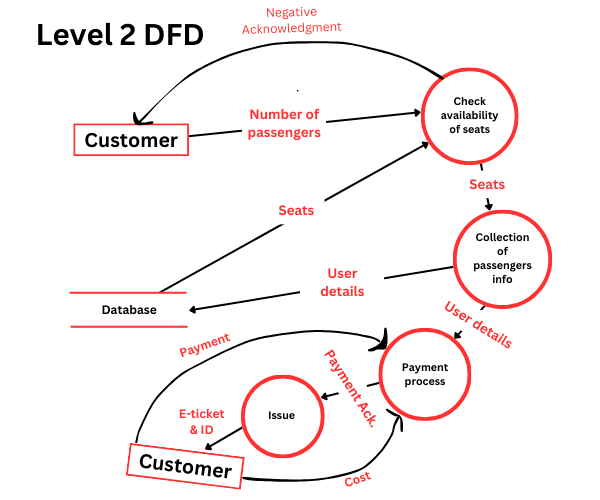
You can see in the diagram above that the external entity "customer" will check the availability of seats. The negative acknowledgement is sent to the customer if seats are unavailable, and the process ends. If seats are available, the number of passengers the customer enters is sent to the further module to collect passenger information. The "Collection of Passengers Information" module stores user details in the database and passes the user details to the "Payment Process" module. The Payment Process tells the customer the ticket cost, and then the customer makes the payment. After the payment is made, the "Payment Process" sends payment acknowledgement to the "Issue Ticket" module and generates a boarding pass for the E-ticket. State DiagramIt is used to capture the behavioural characteristics of the system. The dynamic aspects of the system are depicted with the use of the state diagram. State Diagram Elements
Symbols used in the state diagram are shown in the chart below: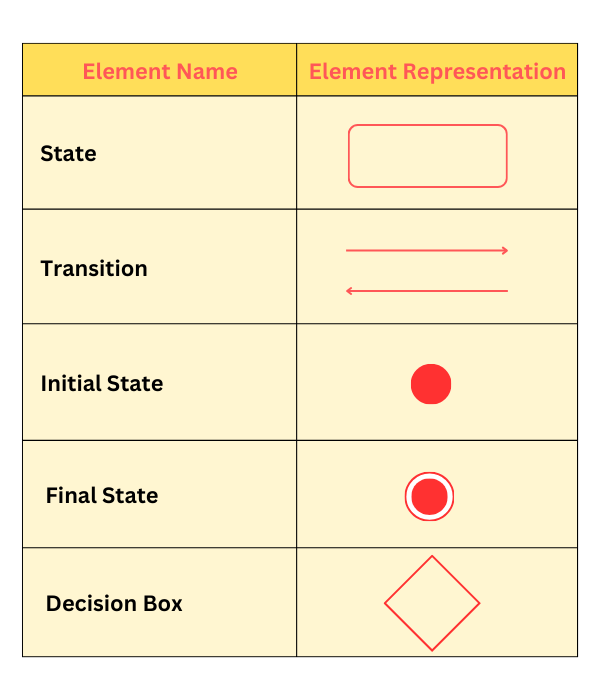
Examples of the state Diagrams Example 1: You can see the following "Order Management System" state diagram, in which there is an initial state and final state of the "Order" object. The first state is an idle state where the process starts. The next states are for events like sending requests, confirming requests and dispatching orders. 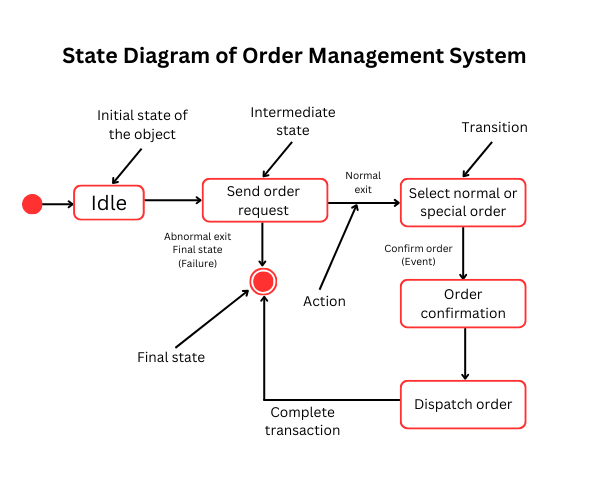
During the life cycle of an object, you can see some abnormal exits that may also occur due to some issue in the system. The event "Send Order Request" occurs in an intermediate state. The "Select Normal or Special Order" event occurs from here, a transition. After that, the "Order Confirmation" and the "Dispatch Order" events occur. When the whole life cycle is complete, it is considered a complete transaction. Example 2: The "University Form Fill-up System" state diagram can be seen below. 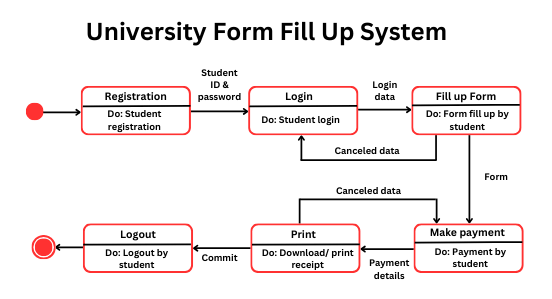
The starting symbol is given in the beginning, and the first state, "Registration", permits students to register their names. The student provides an ID and a password in the "Login" state. If the ID or password is incorrect during the login, the login is cancelled, and the login page reappears. The next stage is the "Fill-up Form" state, where students fill out the form. The students submit the form after filling it out, and then the student is asked to pay registration fees. The payment is completed in the next state called the "Make Payment". The payment details are sent to the further state, which is the "Print", where the form can be printed or downloaded at this state. The "Make Payment" page is opened again if the payment is unsuccessful. The next state is the "Logout" state, where the student is logged out after the form is printed or downloaded. The end state symbol is used at the end after the completion of all the states. Data-Driven ModelingIt is the first graphical model to be a data-driven model. These models represent the steps of processing input data and generating an associated output. They are useful in demonstrating end-to-end processing in a system, which aids in requirement analysis. The data-driven models are shown with the help of Data Flow Diagrams that we have already discussed. Event-driven ModelingIt is the modeling that illustrates the response of the system to internal and external events. It is used to describe the state machine model. The event-driven models are shown with the help of state diagrams that we have already discussed. ConclusionWe have comprehended the behavioural model in software engineering in this article, and we have concluded the following points:
Next TopicContext Model in Software Engineering
|
 For Videos Join Our Youtube Channel: Join Now
Feedback
- Send your Feedback to [email protected]
Help Others, Please Share


