| |

Top Command in Linux/Unix with ExamplesThe top command displays all the running process within the environment of your system. It helps in monitoring system usage and performances. It is mainly used to detect load on the server by system administrators. The top command stands for table of processes. It is a task manager program, detected in several Unix-like operating systems, that shows information about memory and CPU utilization. Overview of Top CommandThe program generates an ordered list of active processes chosen by user-specified format and periodically updates it. Default ordering can be done by CPU usage, and the top CPU consumers are only shown. The top command displays how much memory and processing power is being utilized, as well as other details of the active processes. A few top versions permit extensive customization of display, like sorting methods or choice of columns. The command is helpful for system administrators because it displays which processes and users are utilizing the most system resources at a time. Implementations of Top CommandThere are various different top versions available. The classical Unix version was specified by William LeFebvre and copyrighted in 1984 originally. It's hosted on SourceForge, and the 3.7 version was revealed in 2008. The Linux release of top is an element of the procps-ng tool group. Originally, it was specified by Roger Binns but after that taken over by others shortly. The roughly equivalent function is prstat on Solaris. Microsoft Windows contains the graphical Task Manager utility and tasklist command. IBM AIX contains an updating active processes list as a component of the topas_nmon and topas commands. In Linux, the load average numbers are known as the sum of the total processes waiting inside the run-queue plus the total count executing currently. The number is not relative but absolute. Hence, unlike utilization, it can be unbounded. The instant variations of the total processes are damped using an exponential decay formula calculated with fixed point math. A program, i.e., ps, is the same as the top command but rather generates a process snapshot taken during invocation. The n (total iterations) option of the top command can generate a similar result, making the program execute the specified iterations and exit after showing its result. Options of Top Command
Columns and Fields of Top CommandSome of the important fields or columns available in the top command are explained below:
Syntax: 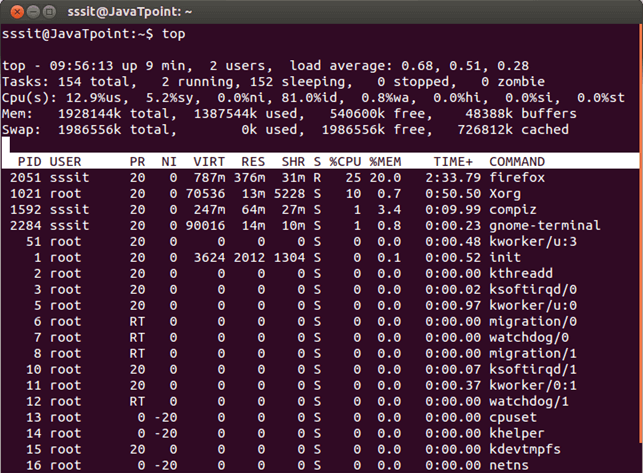
Look at the above snapshot, its output is explained here, Line1
Line2
Line3 It shows CPU usage in percentage for
Line4 It shows memory usage in kilobytes for
Line5 It shows swap memory usage in kilobytes for
Table explanation
If you want you can hide/show these header lines by pressing some keys. For example, press l - to show/hide Line1. Top line press t - to show/hide Line3. CPU information press m - to show/hide Line4 and 5. Memory information Keeping top command running in backgroundYou can keep top command running in the background continuously without typing top in terminal every time. Use ctrl+z keys to get back your terminal. 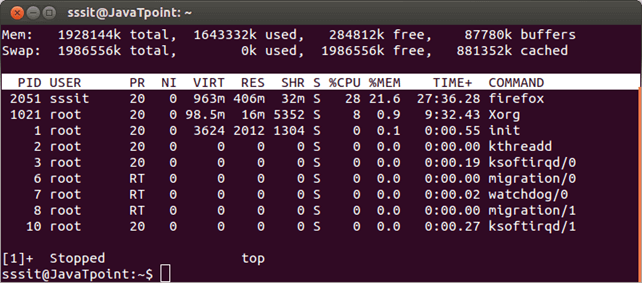
Look at the above snapshot, after pressing ctrl+z keys top command has stopped and we got our terminal back. To bring back top command in terminal type fg in terminal. Sorting top output By default, top command always display output in the order of CPU usage. Press M - To display in order of memory usage. 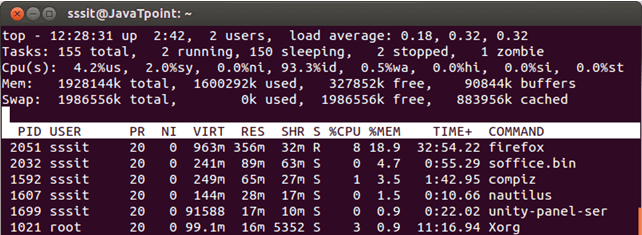
Press O - To display all possible columns that you can sort. 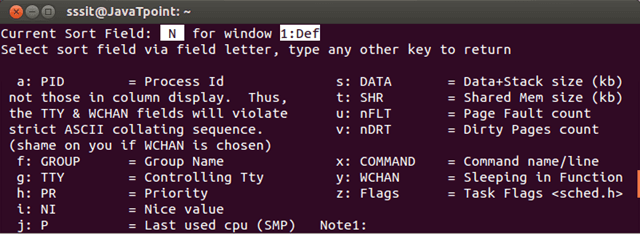
Look at the above snapshot, all the columns are assigned an alphabetic letter. To sort by column type the respective alphabet and output will be sorted according to that column. In the first line, current sort field is shown that is N which means currently it is sorted according to column N. Press R - To display in reverse order. 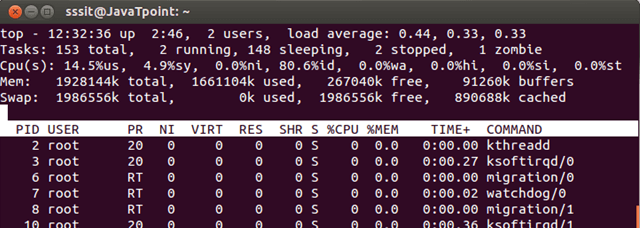
Killing a task without exiting from topA task can be stopped without exiting from top command by pressing k key. It will ask for task's PID number, if you'll have authority to kill that task, then task will be removed. Otherwise, your command will fail. 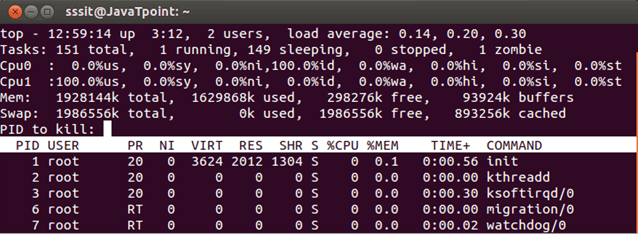
Look at the above snapshot, after pressing k, we got a message asking for PID of task to be killed. Renice a taskRenice is done to change the scheduling order. By pressing r, you can change the priority of a process without killing it. It will also ask for PID of the process. 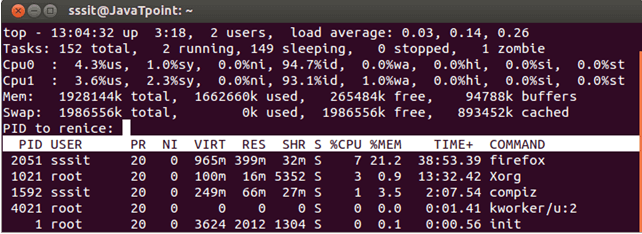
Look at the above snapshot, after pressing r, we got a message asking for PID of task to be reniced. Display processes for selected userIn top command output you can display all the processes for a particular user only by two options. One through command line and other without existing top. In command line, use the following command Syntax: Example: top -u sssit 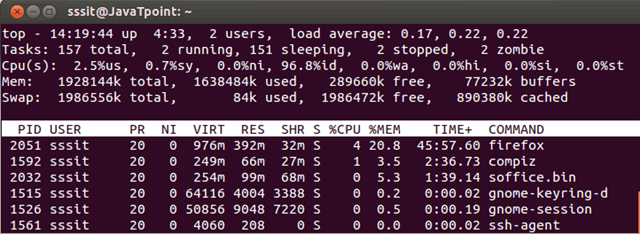
Look at the above snapshot, it displays all the processes only for user sssit. When top command is running, press u, it will ask for username. Type the username and press enter. 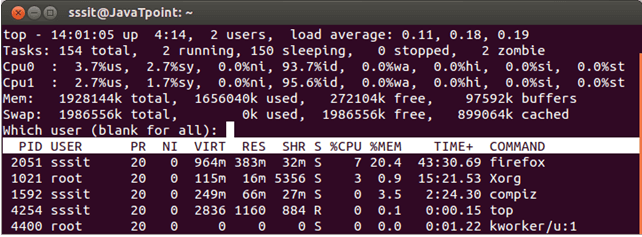
Look at the above snapshot, after pressing u, it is asking for username. Updating top outputBy default, top output is updated after every 3 seconds. When you want to update it in between 3 seconds press space bar. You can also change updating frequency by pressing d key while running top command. 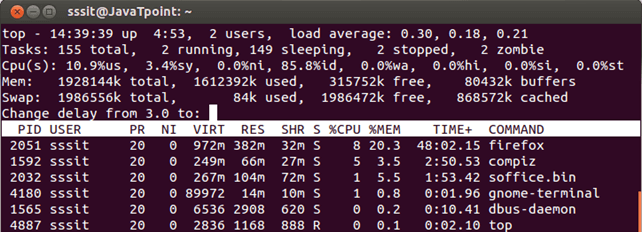
Look at the above snapshot, after pressing d key, it is asking for time for which it will be frequently updated. Changing colorsColors can be changed by pressing z key and text can be made bold by pressing b key. 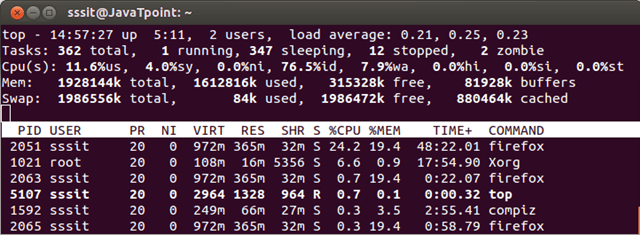
Look at the above snapshot, by pressing b all running processes are highlighted in white. To change color press z (small z) key. 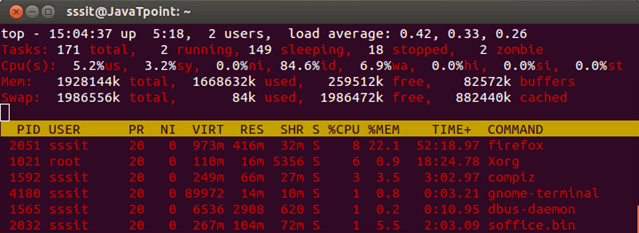
Look at the above snapshot, our output is colored after pressing z. Now, if you want to change the colors for different areas, press Z (capital Z). it will take you to the menu where you can select different colors for different target. 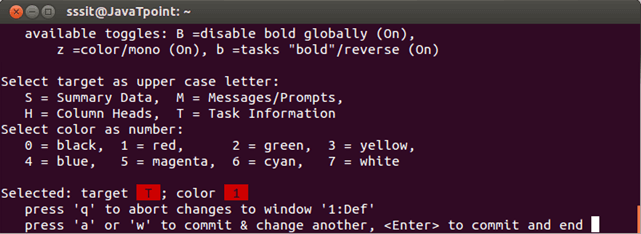
Suppose we want to apply blue color in column heading and magenta color in the task information. Then we'll press 4 with H for heading and 5 with T for task information. 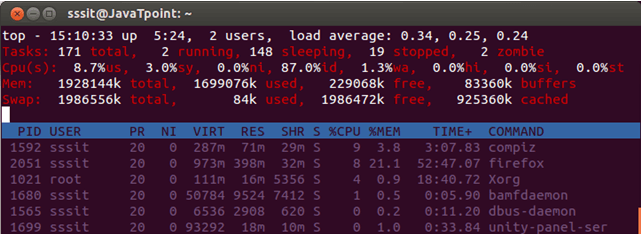
Look at the above snapshot, colors have been changed for their respective target. Quitting after certain iterationsThe top command continuously displays output until you'll quit by pressing q. But you can define certain number of iterations after which top command will automatically quit from the terminal. Syntax: Example: top -n 2 With above example, it will show 2 iterations and exit automatical
Next TopicLinux last
|
 For Videos Join Our Youtube Channel: Join Now
Feedback
- Send your Feedback to [email protected]
Help Others, Please Share


