| |

Linux traceroute commandIntroduction to tracerouteLinux traceroute command is a network troubleshooting utility that helps us determine the number of hops and packets traveling path required to reach a destination. It is used to display how the data transmitted from a local machine to a remote machine. Loading a web page is one of the common examples of the traceroute. A web page loading transfers data through a network and routers. The traceroute can display the routes, IP addresses, and hostnames of routers over a network. It can be useful for diagnosing network issues. In computing, tracert and traceroute are the commands for computer network diagnostics to display possible routes and measure packet transit delays across the IP network. The route history is recorded as the packet round-trip time from all successive hosts in the route; the mean time sum in every hop is the total time measure spent to create the connection. The traceroute command continues unless every sent package is lost more than twice; the connection is lost, and the path can't be evaluated. On the other hand, the ping command only measures the last round-trip times through the destination point. Sometimes, the tool has a similar name, tracert6 and traceroute6, for IPv6. Syntax:Options:The following command-line options are supported by the traceroute command: -f, --first-hop=NUM: It is used to set the initial hop distance. -g, --gateways=GATES: It is used to display a list of gateways for loose source routing. -I, --icmp: It is specified to use ICMP ECHO as a probe. -m, --max-hop=NUM: It is used to set maximal hop count, the default is 64. -M, --type=METHOD: It specifies the METHOD (icmp or udp) for traceroute operations, the default method is udp. -p, --port=PORT: It is defined to use destination PORT port, the default PORT is 33434. -q, --tries=NUM: It is used to forward NUM probe packets per hop, the default is 3. --resolve-hostnames: It is used to resolve the hostnames. -t, --tos=NUM: It is used to set the type of service (TOS) to NUM. -w, --wait=NUM: It is used to wait in seconds for a response, the default is 3. -?, --help: It is used to display the help manual that contains a brief description of supported command-line options and usage. --usage: It displays a short usage message. -V, --version: It is used to display the version information of the traceroute. Let's have a look at the quick index of the topic:
Implementations of tracerouteThe traceroute command is available on several modern OSes. On Unix-like systems such as Linux, macOS, and FreeBSD, it is available as a tool for the command line. Also, traceroute is graphically accessible within the Network Utilities suite in macOS; these utilities have been deprecated since the publication of macOS Big Sur. ReactOS and Microsoft Windows offer a program called tracert that implements a similar route-tracing function. Also, Windows NT-based OSes offer PathPing, which can combine the functionality of the ping command with tracert. The ReactOS edition was integrated by Get Murphy, and it is licensed upon the GPL. By default, traceroute sends an order of UDP (User Datagram Protocol) packets on Unix-like OSes, with port destination numbers ranging from 33434 to 33534. The traceroute implementations shipped with macOS, DragonFly BSD, OpenBSD, NetBSD, FreeBSD, and Linux have the option to utilize ICMP Echo Request packets such as TCP and UDP using ICMP or TCP SYN packets. By default, tracert transfers ICMP Echo Request packets on Windows instead of the UDP packet traceroute transfers. Usage of tracerouteMost implementations have at least some options to define the count of queries to transfer per hop, waiting time for a response, hop limit, and used port. If we don't invoke traceroute with specified options, it shows the available options list, while the man traceroute command represents more details, such as the error flags. Origins of tracerouteThe manual page of the traceroute states that the actual traceroute program was specified by Van Jacobson in 1987 from a recommendation by Steve Deering, with specifically cogent fixes and recommendations from C. Philip Wood, Ken Adelman, and Tim Seaver. Mike Muuss, the ping program author, states that the traceroute was specified with the support of kernel ICMP that he had coded earlier to activate raw ICMP sockets while he initially specified the ping program. Limitations of tracerouteThe limitations of traceroute are infamous and should be considered when utilizing the tool. For instance, a traceroute recognizes paths at the interface level but not at the route level. Other limitations occur when routers don't respond to examination or when routers include a restriction for ICMP responses. Traceroute may represent a path that doesn't exist in the existence of traffic load balancing. To minimize this issue, a traceroute modification is available known as Paris-traceroute, which manages the examination flow identifier to ignore load balancing. Install the traceroute CommandThe traceroute is not a default utility of the Linux system. To use the traceroute, we need to install it manually. To install it, execute one of the following commands: The above commands will install the traceroute utility on our system. After the successful installation, the output will look like as follows: 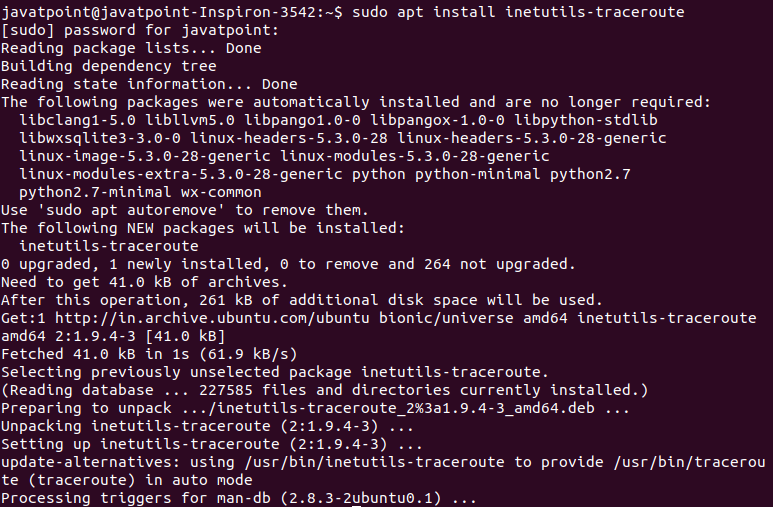
How does it work?To trace the route of a connected network host, pass the name of the server or IP address you want to connect. For example, to trace the route of the server 'javatpoint.com,' execute the below command: The above command will display hops, packets, and much other information on the given route. Consider the below output: 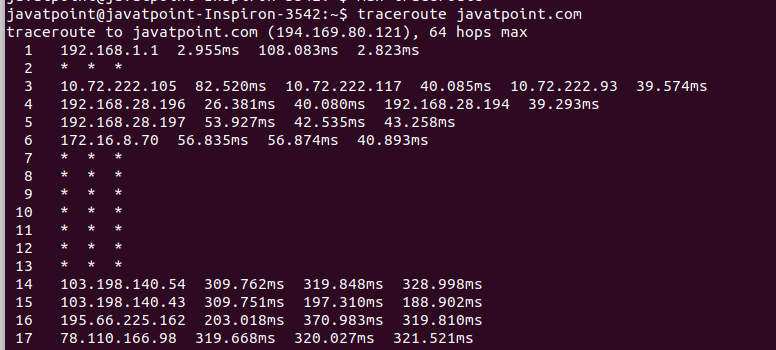
From the above output, we can see several things. let's understand each part of the output:
Trace the Route Using IPv6The '6' option is used to trace the route to a host network using the Ipv6 protocol. Consider the below command: The above command will trace the route to 'google.com' by using the Ipv6 protocol. Consider the below output: 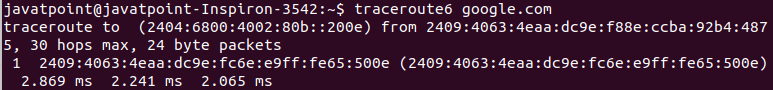
Trace the Route Using Ipv4The '4' option is used to trace the route to a host network using the Ipv6 protocol. Consider the below command: The above command will trace the route to 'google.com' by using the Ipv6 protocol. Consider the below output: 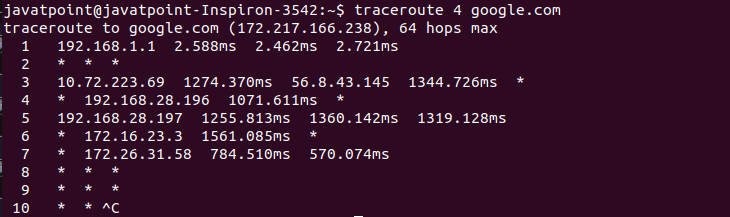
Disable IP Address and Hostname MappingThe 'n' option is used to disable the IP address and hostname mapping. Consider the below command: The above command will produce the output as follows: 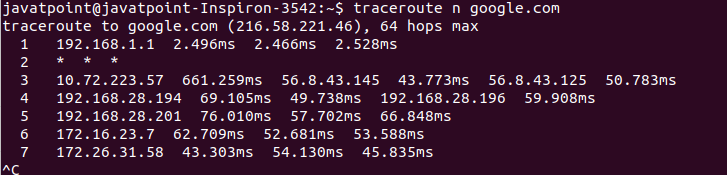
Set the Number of Queries per hopThe '-q' option is used to set the number of queries per hop. Consider the below command: The above command will produce the output as follows: 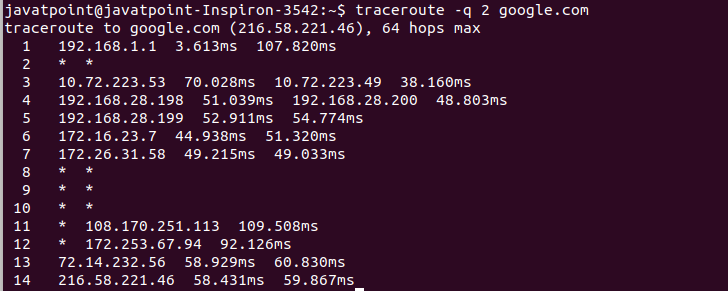
Set the response wait timeThe '-w' option is used to set the response wait time in traceroute. It will specify the wait time in seconds for responding to a probe. Consider the below command: From the above command, the response wait time is 1 second. It will produce the output as follows: 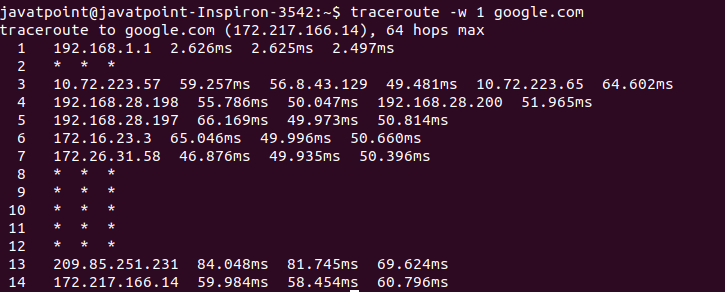
Specify the interface to useThe 'i' option is used to set the network interface that traceroute should use. If it is not set, it will set the interface according to the routing table. Consider the below command: The above command will produce the output as follows: 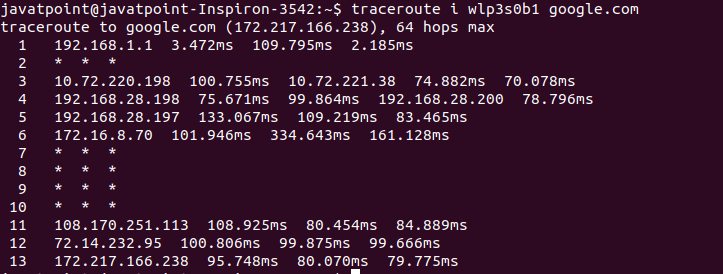
Set the Initial TTL ValueWe can set the initial TTL ( time to live) value other than the default value. It will skip some hops. Usually, it is set to one, two, three, and so on for the respective set of tests. So, if we set it to seven, the first test will attempt the hop seven and skip the hops from one to six. Consider the below command: The above command will go straight to hop seven. Consider the below output: 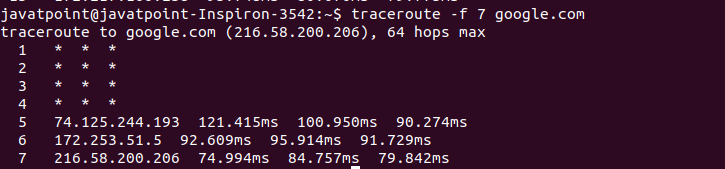
Set the Maximum Number of hopThe '-m' option is used to set the maximum number of hops for the packet to reach the destination. The default value for the maximum number of hops is 30. Consider the below command: The above command will set 7 maximum hops for the packet to reach the destination. Consider the below output: 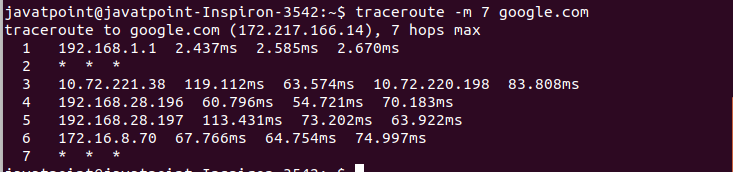
Getting HelpTo display the help manual that contains a summary of usage and supported options, execute the below command: The above command will display the help. It will produce the output as follows: 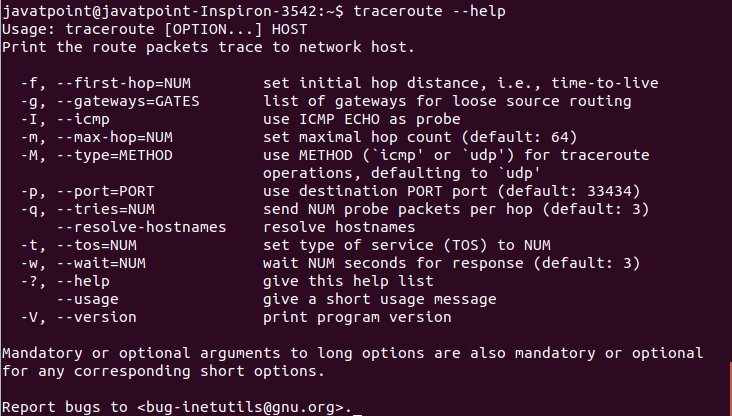
We can also access the manual pages by executing the man command as follows: The above command will display the manual page of the traceroute command. It will look like as follows: 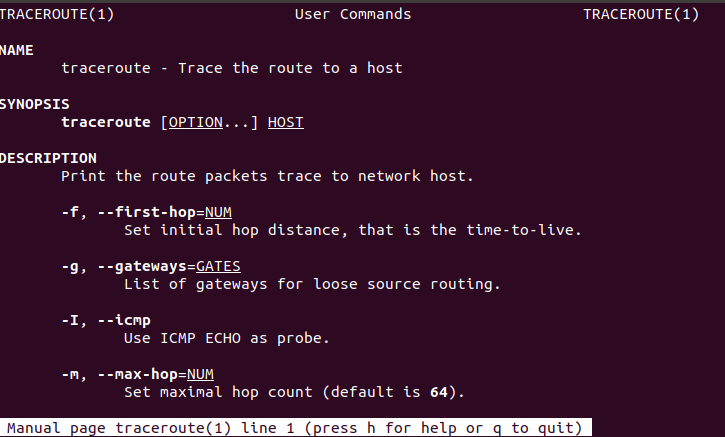
Scroll the page to read more and press the 'q' key to exit from the manual page.
Next TopicLinux tracepath
|
 For Videos Join Our Youtube Channel: Join Now
Feedback
- Send your Feedback to [email protected]
Help Others, Please Share


