| |

SQL Server PROFILERSQL profiler is a GUI tool in Microsoft SQL Server relational database management system that allows us to monitor, analyze, troubleshoot, re-create, and trace the problems of SQL databases and their environments. It was first introduced in the SQL Server 2000 version. It traces activities or operations on a particular database engine. This article will discuss the profiler, how it works, its benefits and drawbacks, as well as alternatives. Developers and Database Administrators can use the profiler to create and handle traces, as well as replay and analyze trace results. It's like a dashboard that displays the health of a Microsoft SQL Server instance. The profiler saves the events in a trace file that can be analyzed or used later to replay a specific series of steps when diagnosing an issue. We can also schedule the traces to run at specific times, such as one trace would be set up to run every morning at 9 a.m. for comparing the performance when the database is active or idle. We can also set another trace to run at 1 a.m. when the database activity is little or no activity. SQL Server Profiler allows DBA to do the following tasks:
How does profiler work in SQL Server?Profiler is a standalone software tool that is installed on the system with SQL Server installation setup. It operates by providing DBAs with a high-level perspective of a system's operation. DBA creates traces to record data, monitor faults and other issues and then uses a profiler to save, retrieve, and graphically view the results for troubleshooting and repair purposes. This function entirely happens on the client-side, which means it uses resources on the same machine that it is monitoring. We can use the Windows Explorer or SQL Server Management Studio to access the profiler. If we are using Windows 10, then type SQL Server Profiler into the Start menu. We will see the application in the results as shown below: 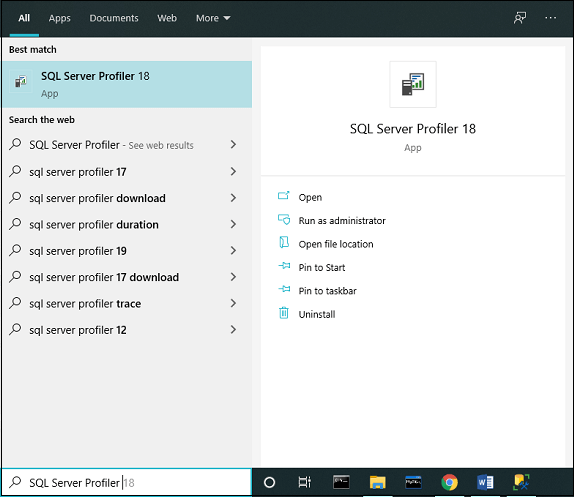
We can also open this tool in the SQL Server Management Studio. To start the profiler, open the management studio, navigate to the Tools menu. Under this menu, we will get the profiler option as shown in the image below: 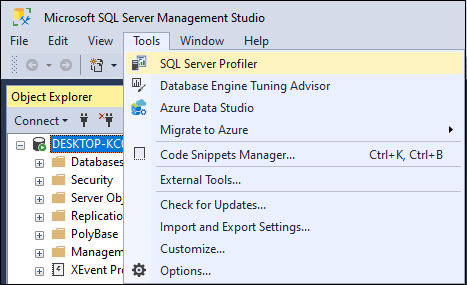
Advantages of PROFILERThe following are the most important benefits of profiler to both developers and DBAs:
How to use PROFILER?When we open the profiler, it will ask for authentication. Here we need to fill in the detail like server type (whether you want to connect to Analysis Service Instance or Database Engine), server name, authentication type, and credentials as shown in the below image: 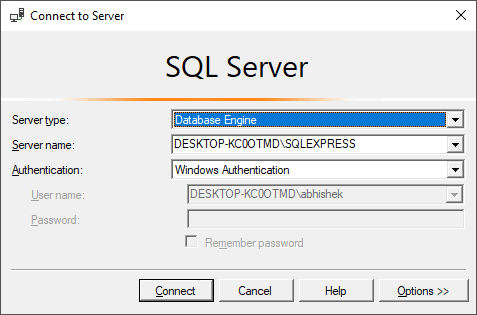
When we click on the connect button, the connection is established, and a new trace form appears on the screen. Here we will see two tabs named General tab and Events Selection as shown below: 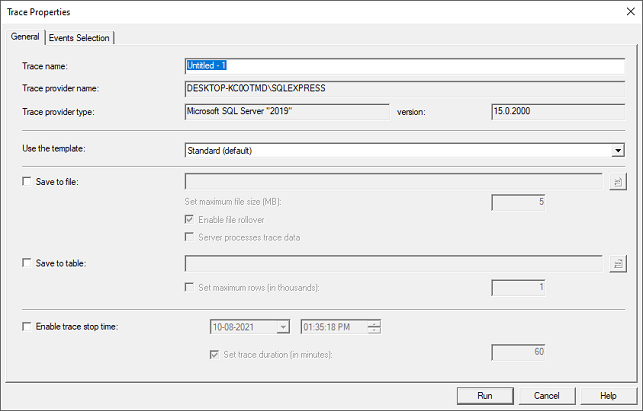
General TabsIt is used for setting the trace database engine. By default, the General tab is selected where we need to enter the trace name. The trace provider name and server name are predefined and cannot be editable. After providing the name, we select whether we want to save the trace results into a table or external file. When we mark the "Save to Table" option, it connects the server and asks which database we want to save that trace table information. Also, we can optionally pause the trace at a specific date-time by checking the "Enable trace stop time" based on our needs. A template is a collection of tuning events captured by the profiler trace. Here we can see several predefined templates such as T-SQL and Tuning, the standard (default) template, and the Blank template, which allows us to start from scratch. We can also choose a trace template from a drop-down menu according to our requirements. Event TabsThe event is an action or operation performed on the database engine. An event tab is used for adding or removing the selected event for monitoring. The profiler tool can trace all events, and each event is categorized on a specific event class. Some examples are BatchCompleted, Batch Starting, Audit Login, Audit Logout, Lock: Acquired, Lock: Released, etc. The below image explains each section of the event tab: 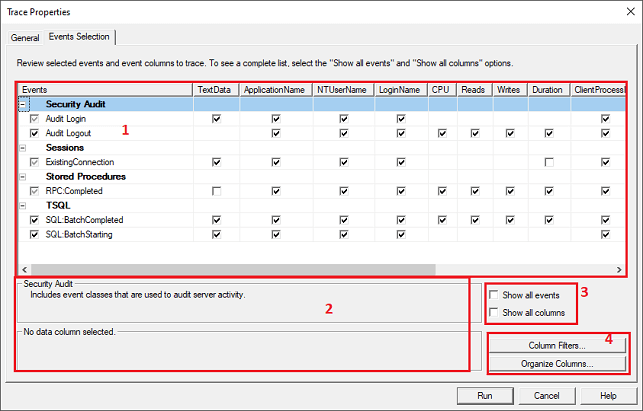
Section 1 is the preview of the selected trace that shows events and columns. It also allows us to select the appropriate check box based on our needs. Section 2 shows the details of the Selected Events and Events class. If we tick the section 3 check box, we will obtain the entire list of Events and Columns in Section 1. Section 4 is like customization that has an option column filters and organizes columns. When we click the "Column Filter button," it allows us to filter more data to be saved by using conditions such as like or not like. When you've finished filtering, click OK to exit the edit filter window and preserve your changes. Here is the image: 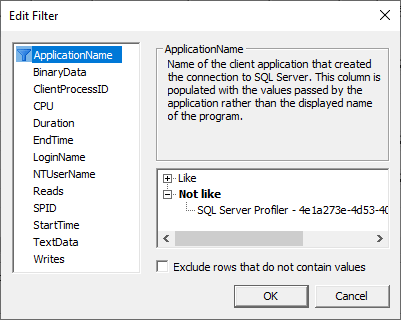
When we click the "Organize Column button," it allows us to organize and group the columns. When you've finished all your functioning, click on the OK button to preserver the changes. 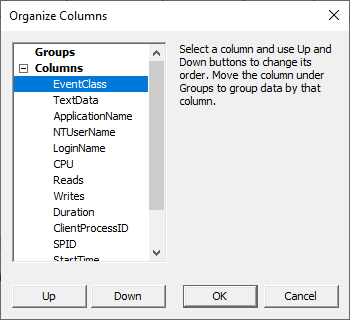
NOTE: Once the trace collection procedure has begun, we cannot make any changes to the column, such as grouping and sorting.Finally, click on the Run button to complete the tasks within the server. Now, we can monitor server data in a tabular manner with various properties. We can also view if the trace is running or not from the bottom of the profiler window. Database Engine Tuning AdvisorIt's a SQL Server tool that allows to read and analyze the traces that the profiler creates. We can access it by using the SQL Server Management Studio. As input, this tool accepts a profiler trace. The operations captured within the trace make certain recommendations (missing indexes, partitioning, etc.) to optimize Database Engine efficiency. Deprecation and AlternativesAccording to the official documentation, the SQL Server Profiler for Database Engine is deprecated. This feature might be removed in a future version of MS SQL Server, and recommended to avoid the use of this feature anymore. However, we can still use this tool to trace Analysis Services as workloads are not deprecated. They deprecate the two operations, which are Trace and Replay. Microsoft opted to construct a new functionality for these actions after deprecating the Trace and Replay features. They suggested that Extended Events be used to build traces over a Database Engine, and the Distributed Replay will be used to accomplish replay operations. They still suggest using SQL Server Profiler to build traces and replays over Analysis Services instances. Some of the other alternatives to perform similar functions as of SQL Server profiler are: Prefix: This tool has an amazing feature to inspect SQL queries directly from your application code for insights that are not only correct but also contextual. It's completely free, extremely powerful, and gives a detailed trace of all web requests. ExpressProfiler: It is a simple open-source best alternative for SQL Server profiler. It uses a simple, fast graphical user interface. It is also called SqlExpress Profiler. Neor Profile SQL: It's an application that acts like a proxy server, intercepting all of the client's requests. This technique allows us to take control of the entire access of the database and discover query bottlenecks. It provides similar features for MySQL users. Server Side Trace: It runs on the server and saves the trace data same as the profiler but captured using T-SQL scripts. Replay in SQL Server ProfilerSQL Server profiler provides a replay feature that allows us to save a trace and replay it based on our needs. It is very important when we are troubleshooting an application. SQL Server Profiler Replay menu provides Toggle Breakpoint and the Run to Cursor options for debugging. The profiler will monitor all changes made in SQL Server Management Studio. As a result, it can also be used to test database performance. SQL Server also provides the "SQL Server Performance Monitor" for monitoring the performance of the system and server. ConclusionThis article will describe the old SQL Server tracing tool called profiler. Here we have also learned about its use cases and other SQL Server tools that can integrate. It also mentions the benefits of the profiler tool and its alternatives that can be used after it is deprecated for tracing the Database Engine.
Next TopicSQL Server Functions
|
 For Videos Join Our Youtube Channel: Join Now
Feedback
- Send your Feedback to [email protected]
Help Others, Please Share


