| |

DebuggingTo launch an application into the market, it is very necessary to cross-check it multiple times so as to deliver an error-free product. When we talk about delivering a bug-free product, then our main concern is all about customer satisfaction because if you are application is not up to the mark, then eventually it will demolish the company's reputation in the market. In this article, we are going to see what makes debugging stand out of the queue and how it is different from software testing. We will be discussing the following topics:
What is Debugging?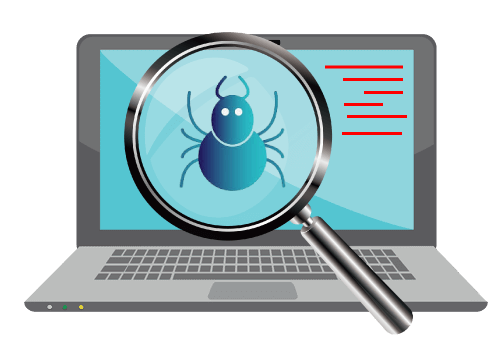
In the development process of any software, the software program is religiously tested, troubleshot, and maintained for the sake of delivering bug-free products. There is nothing that is error-free in the first go. So, it's an obvious thing to which everyone will relate that as when the software is created, it contains a lot of errors; the reason being nobody is perfect and getting error in the code is not an issue, but avoiding it or not preventing it, is an issue! All those errors and bugs are discarded regularly, so we can conclude that debugging is nothing but a process of eradicating or fixing the errors contained in a software program. Debugging works stepwise, starting from identifying the errors, analyzing followed by removing the errors. Whenever a software fails to deliver the result, we need the software tester to test the application and solve it. Since the errors are resolved at each step of debugging in the software testing, so we can conclude that it is a tiresome and complex task regardless of how efficient the result was. Why do we need Debugging?Debugging gets started when we start writing the code for the software program. It progressively starts continuing in the consecutive stages to deliver a software product because the code gets merged with several other programming units to form a software product. Following are the benefits of Debugging:
Steps involved in DebuggingFollowing are the different steps that are involved in debugging: 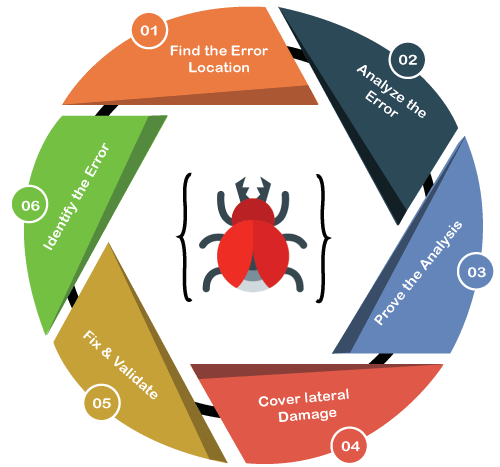
Debugging Strategies
Debugging Tools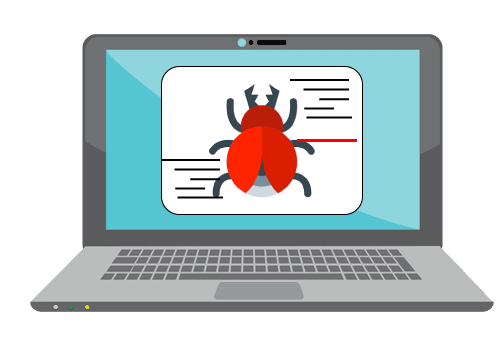
The debugging tool can be understood as a computer program that is used to test and debug several other programs. Presently, there are many public domain software such as gdb and dbx in the market, which can be utilized for debugging. These software offers console-based command-line interfaces. Some of the automated debugging tools include code-based tracers, profilers, interpreters, etc. Here is a list of some of the widely used debuggers:
Radare2Radare2 is known for its reverse engineering framework as well as binary analysis. It is made up of a small set of utilities, either utilized altogether or independently from the command line. It is also known as r2. It is constructed around disassembler for computer software for generating assembly language source code from machine-executable code. It can support a wide range of executable formats for distinct architectures of processors and operating systems. 
WinDbgWinDbg is a multipurpose debugging tool designed for Microsoft Windows operating system. This tool can be used to debug the memory dumps created just after the Blue Screen of Death that further arises when a bug check is issued. Besides, it is also helpful in debugging the user-mode crash dumps, which is why it is called post-mortem debugging. 
ValgrindThe Valgrind exist as a tool suite that offers several debugging and profiling tools to facilitate users in making faster and accurate program. Memcheck is one of its most popular tools, which can successfully detect memory-related errors caused in C and C++ programs as it may crash the program and result in unpredictable behavior. 
Next TopicGNU Wget
|
 For Videos Join Our Youtube Channel: Join Now
Feedback
- Send your Feedback to [email protected]
Help Others, Please Share


