| |

Hypothesis in Machine LearningThe hypothesis is a common term in Machine Learning and data science projects. As we know, machine learning is one of the most powerful technologies across the world, which helps us to predict results based on past experiences. Moreover, data scientists and ML professionals conduct experiments that aim to solve a problem. These ML professionals and data scientists make an initial assumption for the solution of the problem. This assumption in Machine learning is known as Hypothesis. In Machine Learning, at various times, Hypothesis and Model are used interchangeably. However, a Hypothesis is an assumption made by scientists, whereas a model is a mathematical representation that is used to test the hypothesis. In this topic, "Hypothesis in Machine Learning," we will discuss a few important concepts related to a hypothesis in machine learning and their importance. So, let's start with a quick introduction to Hypothesis. What is Hypothesis?The hypothesis is defined as the supposition or proposed explanation based on insufficient evidence or assumptions. It is just a guess based on some known facts but has not yet been proven. A good hypothesis is testable, which results in either true or false. Example: Let's understand the hypothesis with a common example. Some scientist claims that ultraviolet (UV) light can damage the eyes then it may also cause blindness. In this example, a scientist just claims that UV rays are harmful to the eyes, but we assume they may cause blindness. However, it may or may not be possible. Hence, these types of assumptions are called a hypothesis. Hypothesis in Machine Learning (ML)The hypothesis is one of the commonly used concepts of statistics in Machine Learning. It is specifically used in Supervised Machine learning, where an ML model learns a function that best maps the input to corresponding outputs with the help of an available dataset. 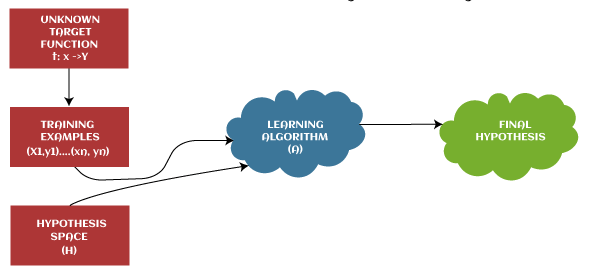
In supervised learning techniques, the main aim is to determine the possible hypothesis out of hypothesis space that best maps input to the corresponding or correct outputs. There are some common methods given to find out the possible hypothesis from the Hypothesis space, where hypothesis space is represented by uppercase-h (H) and hypothesis by lowercase-h (h). Th ese are defined as follows: Hypothesis space (H):Hypothesis space is defined as a set of all possible legal hypotheses; hence it is also known as a hypothesis set. It is used by supervised machine learning algorithms to determine the best possible hypothesis to describe the target function or best maps input to output. It is often constrained by choice of the framing of the problem, the choice of model, and the choice of model configuration. Hypothesis (h):It is defined as the approximate function that best describes the target in supervised machine learning algorithms. It is primarily based on data as well as bias and restrictions applied to data. Hence hypothesis (h) can be concluded as a single hypothesis that maps input to proper output and can be evaluated as well as used to make predictions. The hypothesis (h) can be formulated in machine learning as follows:
y= mx + b
Where, Y: Range m: Slope of the line which divided test data or changes in y divided by change in x. x: domain c: intercept (constant) Example: Let's understand the hypothesis (h) and hypothesis space (H) with a two-dimensional coordinate plane showing the distribution of data as follows: 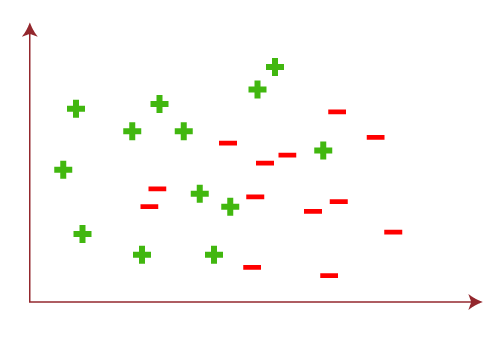
Now, assume we have some test data by which ML algorithms predict the outputs for input as follows: 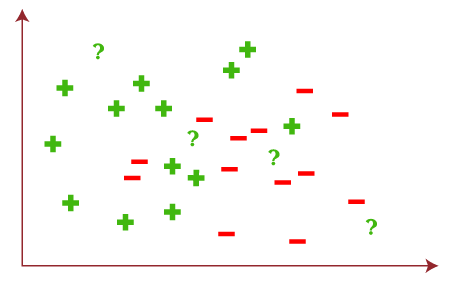
If we divide this coordinate plane in such as way that it can help you to predict output or result as follows: 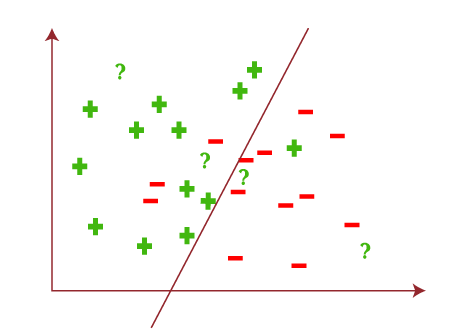
Based on the given test data, the output result will be as follows: 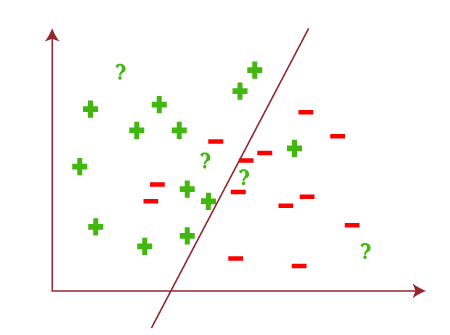
However, based on data, algorithm, and constraints, this coordinate plane can also be divided in the following ways as follows: 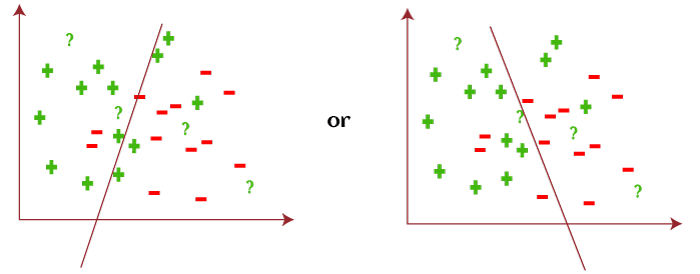
With the above example, we can conclude that; Hypothesis space (H) is the composition of all legal best possible ways to divide the coordinate plane so that it best maps input to proper output. Further, each individual best possible way is called a hypothesis (h). Hence, the hypothesis and hypothesis space would be like this: 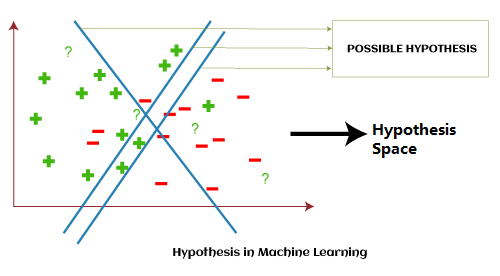
Hypothesis in StatisticsSimilar to the hypothesis in machine learning, it is also considered an assumption of the output. However, it is falsifiable, which means it can be failed in the presence of sufficient evidence. Unlike machine learning, we cannot accept any hypothesis in statistics because it is just an imaginary result and based on probability. Before start working on an experiment, we must be aware of two important types of hypotheses as follows:
Significance levelThe significance level is the primary thing that must be set before starting an experiment. It is useful to define the tolerance of error and the level at which effect can be considered significantly. During the testing process in an experiment, a 95% significance level is accepted, and the remaining 5% can be neglected. The significance level also tells the critical or threshold value. For e.g., in an experiment, if the significance level is set to 98%, then the critical value is 0.02%. P-valueThe p-value in statistics is defined as the evidence against a null hypothesis. In other words, P-value is the probability that a random chance generated the data or something else that is equal or rarer under the null hypothesis condition. If the p-value is smaller, the evidence will be stronger, and vice-versa which means the null hypothesis can be rejected in testing. It is always represented in a decimal form, such as 0.035. Whenever a statistical test is carried out on the population and sample to find out P-value, then it always depends upon the critical value. If the p-value is less than the critical value, then it shows the effect is significant, and the null hypothesis can be rejected. Further, if it is higher than the critical value, it shows that there is no significant effect and hence fails to reject the Null Hypothesis. ConclusionIn the series of mapping instances of inputs to outputs in supervised machine learning, the hypothesis is a very useful concept that helps to approximate a target function in machine learning. It is available in all analytics domains and is also considered one of the important factors to check whether a change should be introduced or not. It covers the entire training data sets to efficiency as well as the performance of the models. Hence, in this topic, we have covered various important concepts related to the hypothesis in machine learning and statistics and some important parameters such as p-value, significance level, etc., to understand hypothesis concepts in a better way.
Next TopicGaussian Discriminant Analysis
|
 For Videos Join Our Youtube Channel: Join Now
Feedback
- Send your Feedback to [email protected]
Help Others, Please Share


