| |

Semrush TwitterIntroductionThe Twitter report from Social Tracker offers several following methods to analyze your and your competitors' activity on the platform. 
Navigation and Settings
The Social Tracker, by default, displays data from your primary business for the previous seven days. The blue drop-down menu or calendar seen above the report can be used to modify these settings. The company and date range you choose at the top will determine the data in the tool. The Twitter report in the Social Tracker is divided into seven categories: Tweets, Audience, Activity, Engagement, Hashtags, Mentioners, and Mentions. Use the subheads on the Twitter tab to move between the various components. Tweets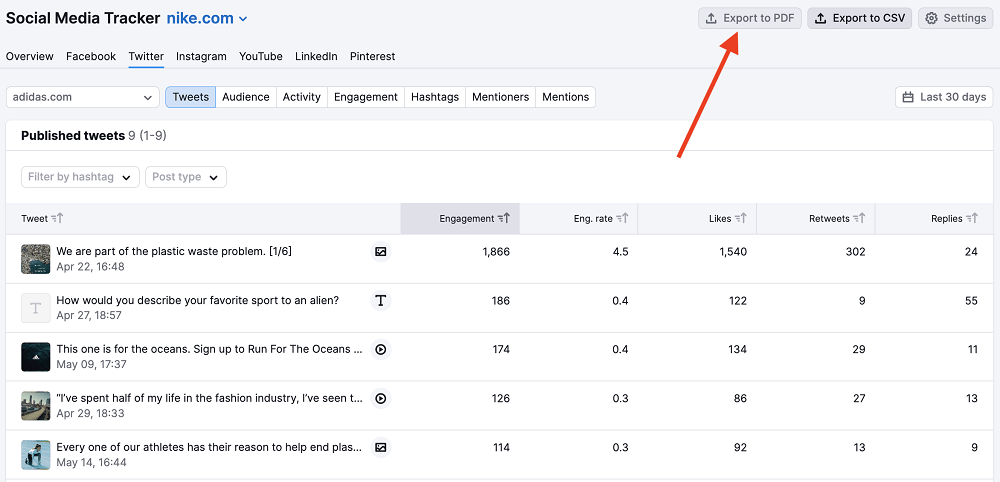
Analyzing tweets from you or a rival is how you should utilize the Twitter report initially. Choose "All profiles" to compare all of the profiles in the project or "One company" to focus on just one competitor's tweets from the business option. These parameters will determine the information in your report. The most current tweets are at the top of the list in the table, which lists tweets according to their posting date. The table may be sorted by column headers (total engagement, engagement rate, likes, retweets, or replies) to uncover tweets that performed well in various ways. For instance, you may examine "All profiles" and sort the column by various metrics to determine which of your rivals tweeted the most interesting, well-liked, and retweeted messages. Filters
Two more filtering options are above the table: by hashtags or tweet type. To select a hashtag, click the field next to "Filter by hashtags" and browse through all the ones used in the tweets. You can view the precise tweets that used the hashtag from the specified date period in the table. The type of tweets is another approach to filtering the tweets. Semrush tracks several distinct kinds of tweets, including:
Tweets are Exported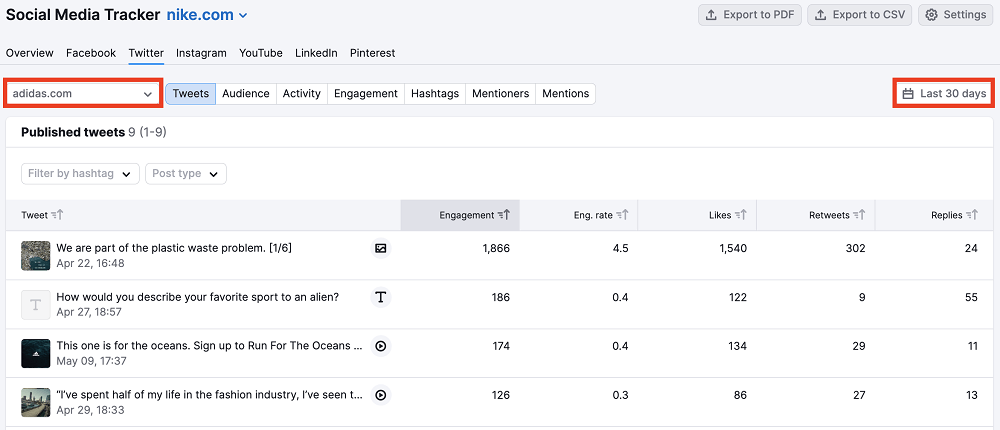
The settings options are located at the top right of the interface and allow users to export a list of tweets from this report to a PDF or spreadsheet (CSV). The chosen business and period will determine the PDF's content. After the PDF download, you can email, schedule, brand, or produce a unique report. By generating a custom report, which will take you to the Report Builder under My Reports, you may completely change the elements of your PDF report. Audience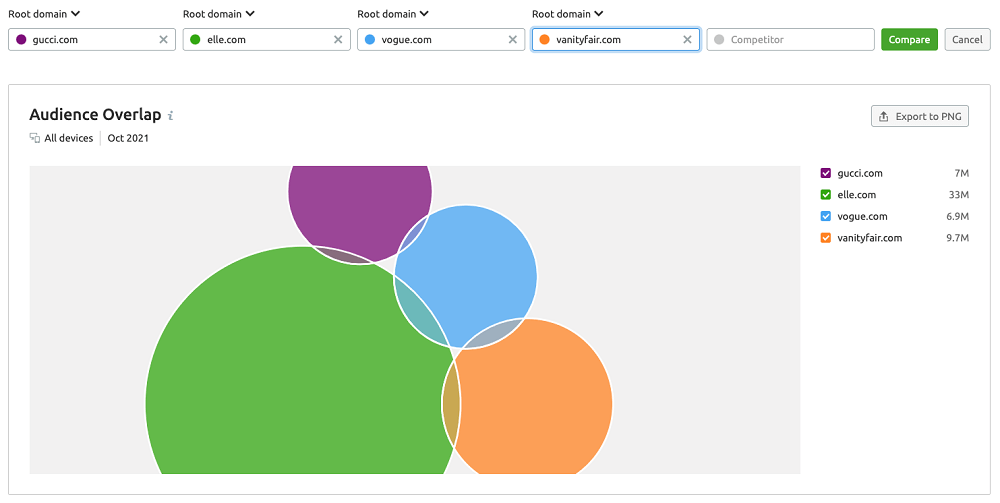
Look into the size and development of the Twitter audiences of your competitors in the following area under Twitter. The total number of followers for the chosen firm over the specified date period compared to the preceding date range will be displayed at the top of the report. For instance, if you choose a date range of the previous 30, your audience today will be compared with your audience then. If your date range is set to the previous week, your audience size today will be compared with your audience from that week. The level of change and growth will be represented by the colors green for positive change and red for negative change. Trend Followers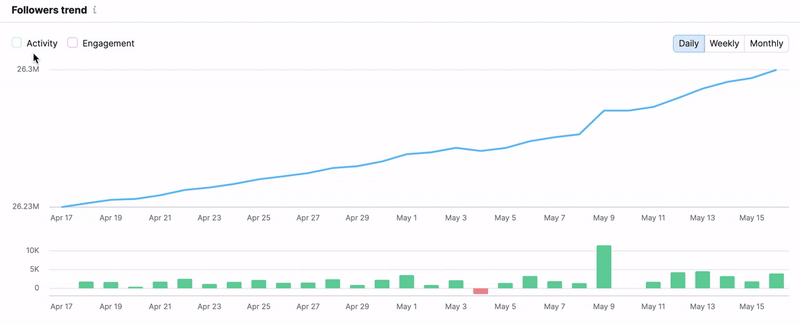
The following section allows you to see the evolution of a company's total number of Twitter followers. The graph may be used to plot points daily, weekly, or monthly. You must only click the boxes in the graph's upper-left corner to add Activity and Engagement lines. In Comparison to Rivals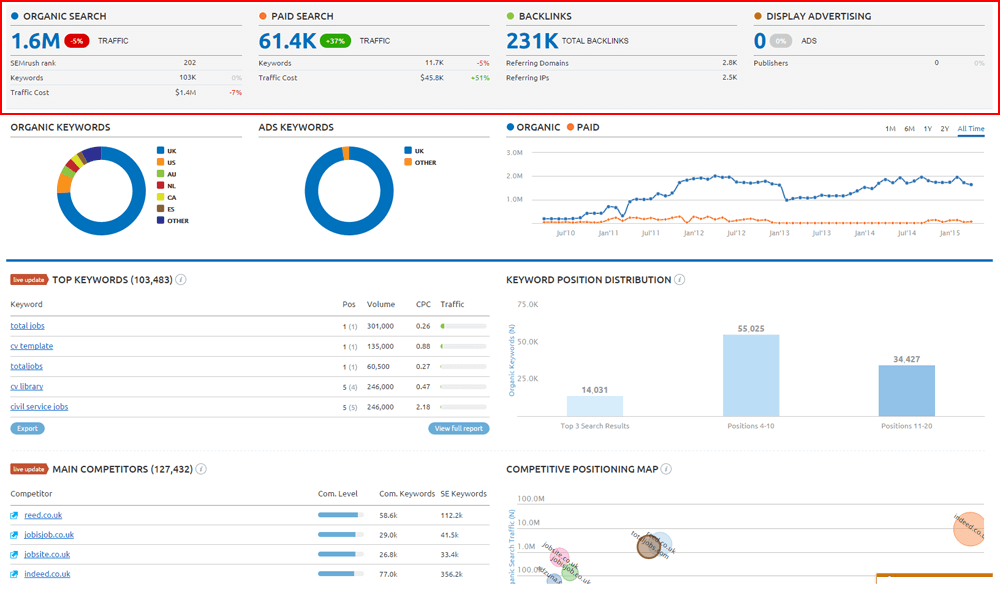
The following graph on this page compares the audience growth tendencies of each business. The points on this graph can once more be plotted daily, weekly, or monthly. To remove rivals from the comparison, choose the colored box underneath the graph. Total Followers in Comparison to the Competition
The final graph contrasts the combined audiences of the companies supporting your cause. The date range provided at the beginning of the report is compared to the date range that came before it in the change column. You may rank the competitors in this graph based on whose audience is the biggest, whose audience changed the most, and whose audience grew by the most significant proportion relative to their audience size. Activity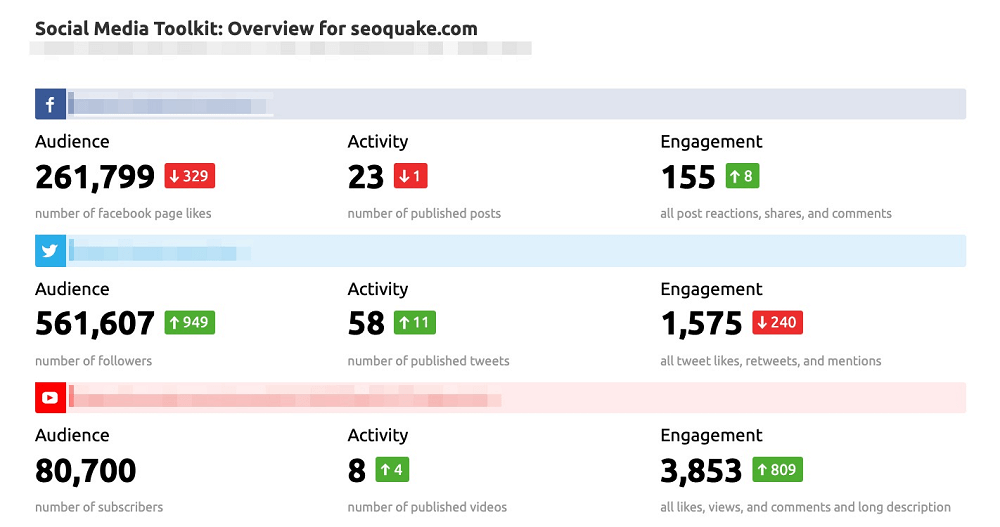
You may examine your Twitter competitors' activity more in-depth under the Activity section. The top of the report includes:
Any change in a competitor's tweeting activity throughout the given date range will be evident from this section, thanks to the red or green values representing change and growth. Performance of Published Posts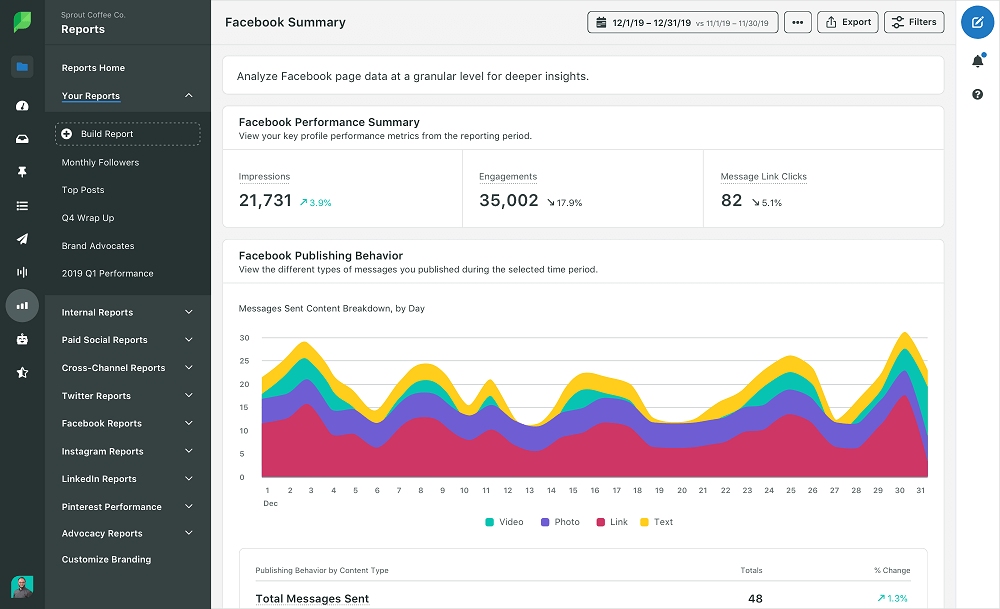
Check out this area to see what kind of tweets engage a competitor's audience the most. Here, you can compare how frequently a competitor tweeted various tweet formats (links, videos, images, and status updates) and how much engagement each received from their followers. The circle chart on the left will show how these various tweet kinds are distributed. Trend in Publishing
This graph shows the historical pattern of a competitor's tweeting. Points can be shown daily, weekly, or monthly depending on the period range you choose. The colorful bars will be displayed below the blue line, one for each type of tweet. Compared to Competitors, the Publishing Trend
The publication trends of all of your project's competitors are compared in the above graph. Once more, you may plot the lines daily, weekly, or monthly. You may select to compare a certain kind of tweet at the top right. Find opportunities to experiment with publishing different tweets by learning whose competitors post the most videos, photographs, links, or status updates. Deselect the colored box next to any competitor's name to take them off of the comparison graph. Compared to Competitors, How Many Tweets Were Published?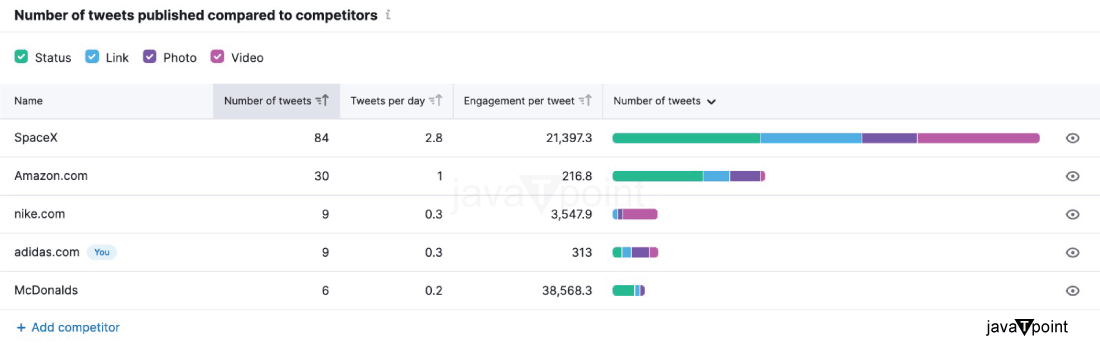
In the above graph compares how many tweets your competitors collectively sent over the chosen period. The competitors may be sorted according to their overall, daily, or post-level engagement numbers for tweets. Use the eye symbol to the left of a competitor's name to remove them from this comparison. Engagement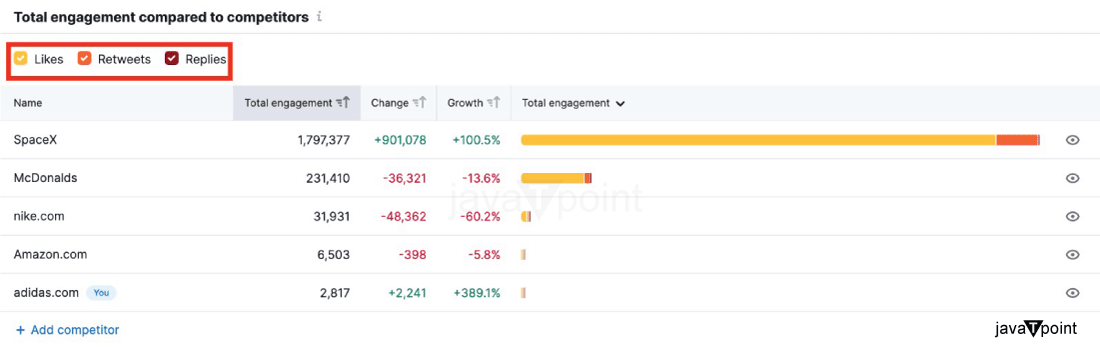
The Engagement section describes how well your competitors engage their Twitter followers. The sum of a Twitter account's lifetime likes, retweets, and comments is used to determine the account's overall engagement. The top makes it simple to assess if the company's engagement levels have increased (green) or decreased (red) from the prior date period. Summary of the Engagement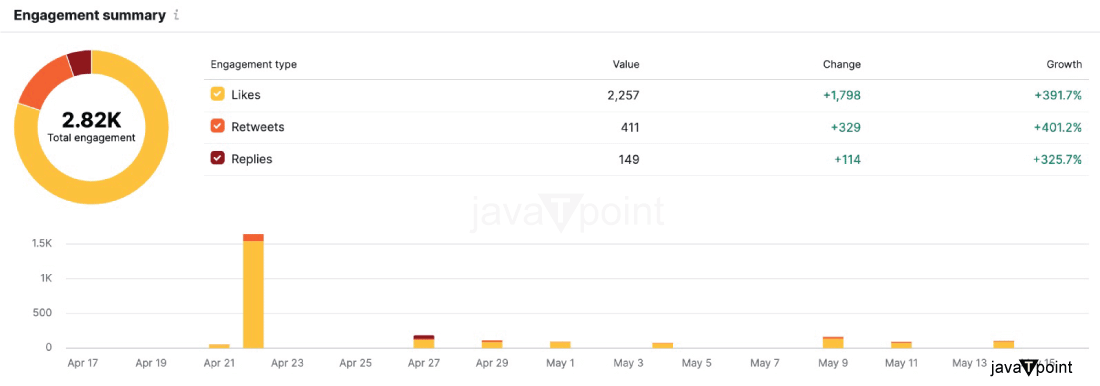
The overall engagement score for a Twitter profile throughout the chosen period appears above. The score will be broken down into likes, retweets, and responses in the circle chart to the left. You may check whether a profile changed for better or worse across the date span for each engagement. The daily interactions the profile had throughout the time period are shown in bar graphs at the bottom of this paragraph. Comparing the Engagement Trend to the CompetitionThis line graph examined the engagement patterns for each of your project's rivals over time. This graph, which compares the overall interaction, likes, retweets, or replies from all of the competitors, may be shown daily, weekly, or monthly. Total Engagement in Comparison to the CompetitionThe concluding chart compares the total audiences of the businesses involved in your project. To focus on comparing one or two forms of interaction, you can deselect any specific engagement (likes, retweets, or responses) using the colored squares below the graph. For instance, you must remove likes and responses from the graph if you only want to examine whose profile received the most retweets within the selected period. Sorting options for this graph include total engagement, amount of change, and growth rate. You may find out which competitor is receiving more engagement compared to their involvement in the prior period by sorting by growth percentage. By clicking any rivals' names on the left side remove option are available; you can click and remove them from this comparison. Hashtags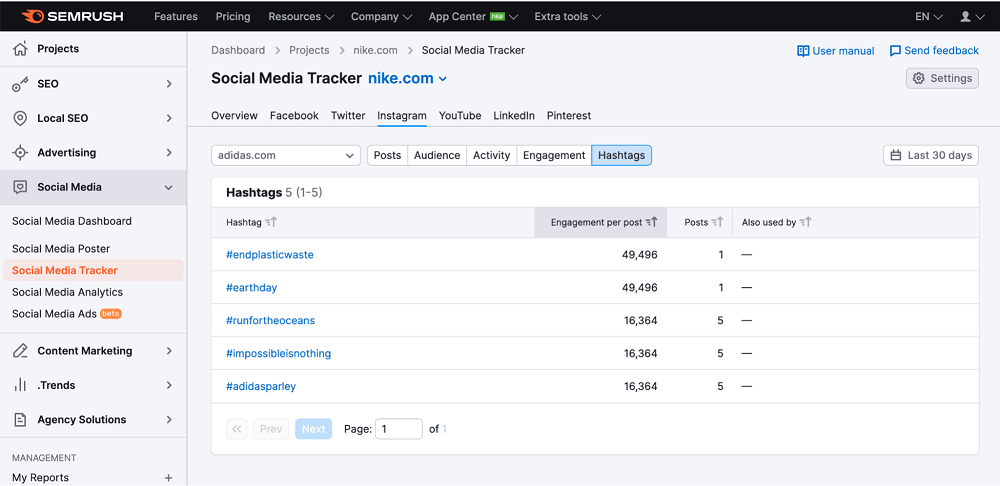
You may get a list of all the hashtags a profile has used within the given period with the Hashtags report. You may check which competitive competitor used hashtags to their most significant advantage by choosing "All profiles" in the company selection. When you click on a hashtag, a pre-filtered report of tweets will display so you can view the precise tweets that include that hashtag. Mentioners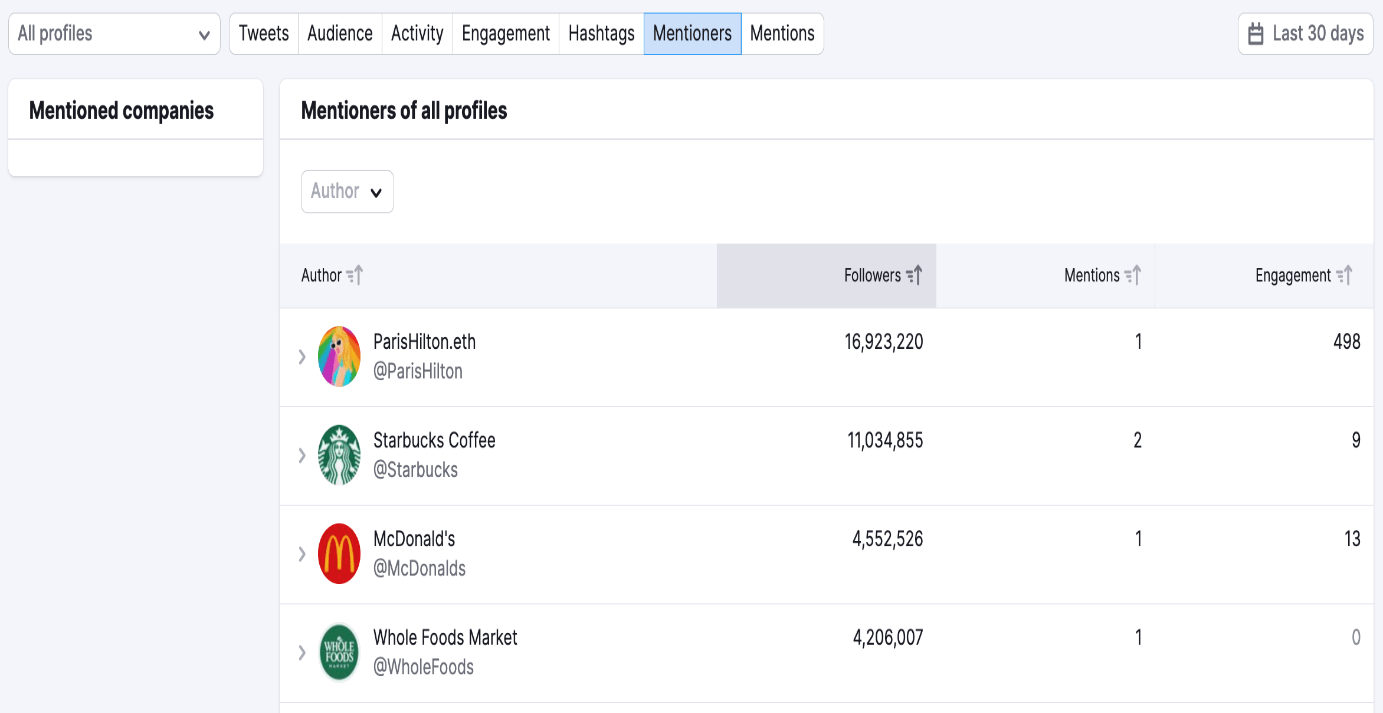
The list of all Twitter profiles referencing your competitors within the specified period may be seen on the mentioner's page. With the help of this report, you can find out if your page is being mentioned on Twitter, whether you are mentioned more frequently than your competitors, and how many people interact with the tweets that reference you and your competitors. From the list to the left of the table, select the profile you want to see mentioners for or click "All profiles" to show mentioners for every profile in your project. Mentions
You can utilize the Twitter report to find all the profiles that mention a competitor's account within a specific time. The table will display all accounts referencing the competitor after changing the company in the selector and selecting a date period to define the report's criteria. The table defaults to showing the accounts with the most followers at the top, but you may alternatively order the tweets by Total engagement, Likes, or Retweets. This analysis will show you how successful competitors are performing influencer outreach to be mentioned on Twitter by a more significant account. This list may be used to get inspiration for your Twitter outreach or to find well-known accounts discussing other businesses in your industry or area. Utilize the "All mentioners" section and browse the list to discover a particular mention. Please choose one from the list, then look at the tweets in which they addressed the competitor.
Next TopicCan I Use Semrush for a Free
|
 For Videos Join Our Youtube Channel: Join Now
Feedback
- Send your Feedback to [email protected]
Help Others, Please Share


