| |

Semrush Website TrafficDiscover website traffic data with Semrush Traffic Analytics - a powerful tool for market research and competitive analysis that accurately calculates desktop and mobile traffic. It may assist you in benchmarking, assessing a new market or specialty, and even creating a healthy media buying plan. 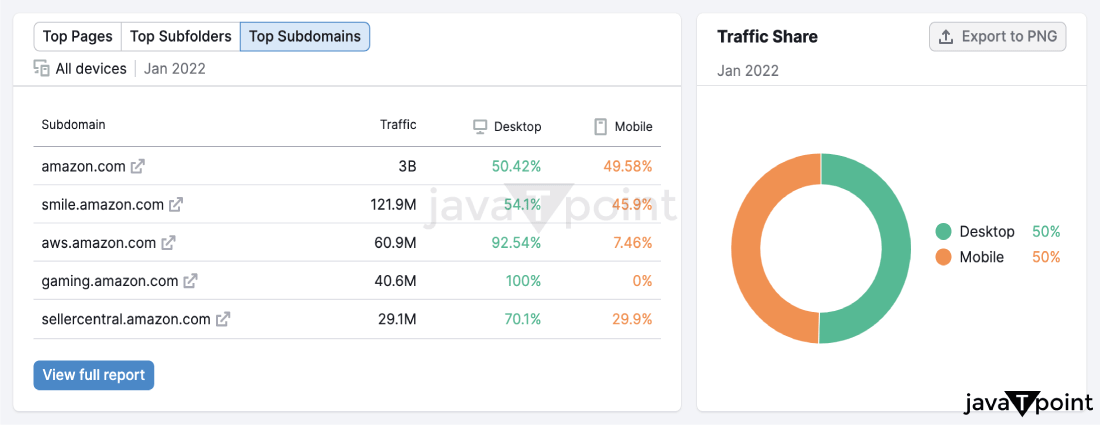
With the tool, you may learn more about a website's traffic sources, audience engagement strategies, preferred device types, audience overlap between other websites, and more. Semrush's Traffic Analytics is a precious product for market researchers, marketing managers, business development teams, and sales teams due to its market intelligence data. Estimates of the total number of visitors to a domain's subdomains and subfolders
Analytics for Traffic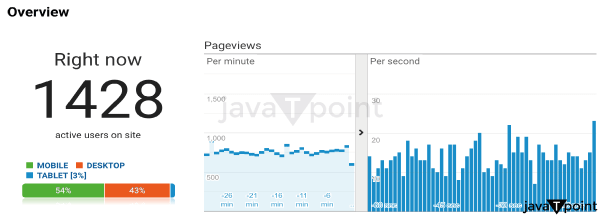
Analyze the website traffic statistics of your competition, identify areas for improvement, and strengthen your marketing plan.
Perfect your Traffic Generation ApproachRecognize the marketing budgeting practices of competitors.
Uncover web traffic Journeys with Actual User DataExplore user journeys and pinpoint platforms that drive the most website traffic.
For Information on the Top pages of competitors' websites, look at their website TrafficDiscover website data for specific pages to learn about the most popular products and content competitors offer.
Get a Complete Overview of the Market ResearchYou can optimize your marketing tactics with comprehensive competitor information and website traffic research.
Analytics for Traffic Filters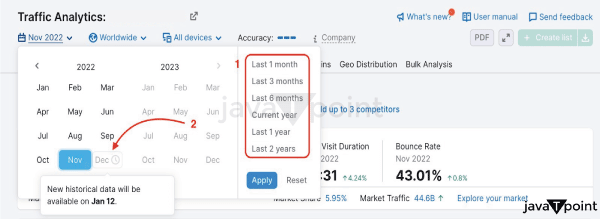
You can see three filters on top of the report.
Thanks to historical data, you may research on a month-by-month basis starting in January 2017. The Date option provides access to these data points, which reflect averages for the specific month. When you click the date, a dropdown box will appear to allow you to choose a specific month or time frame (1) to see data. Additionally, you can see when the metrics from the prior month will be collected (2). You may use the database filter to view the Global, country-specific, or business/geographical region metrics. To view the data, click Worldwide and choose the nation from the dropdown menu: 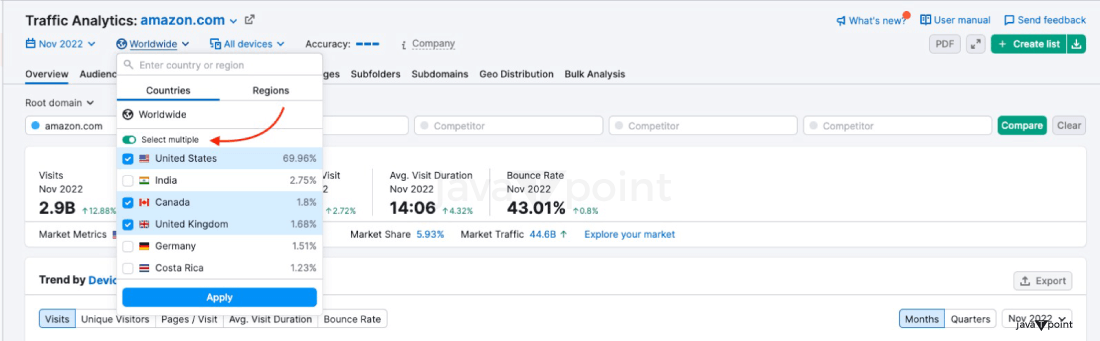
You may now study data for numerous nations at once in one dashboard with the new "select multiple" option. Choose the "Select multiple" checkbox, open the location dropdown menu, and select the nations you want to examine. All of the Traffic Analytics reports will include traffic information for the countries you have chosen, making it easier than ever to do a personalized online traffic study. 
Please be aware that the Audience Overview report does not include this option: 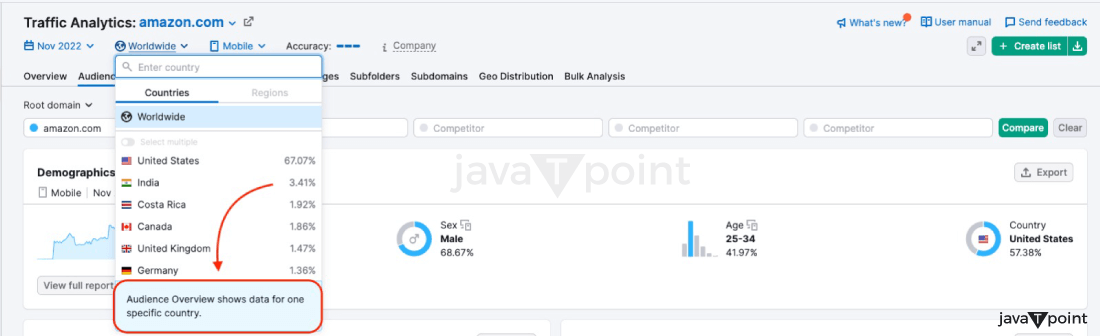
You may also choose a business or a geographic location to access different data based on your business needs. Except for Audience Overview, all reports currently support this filter. 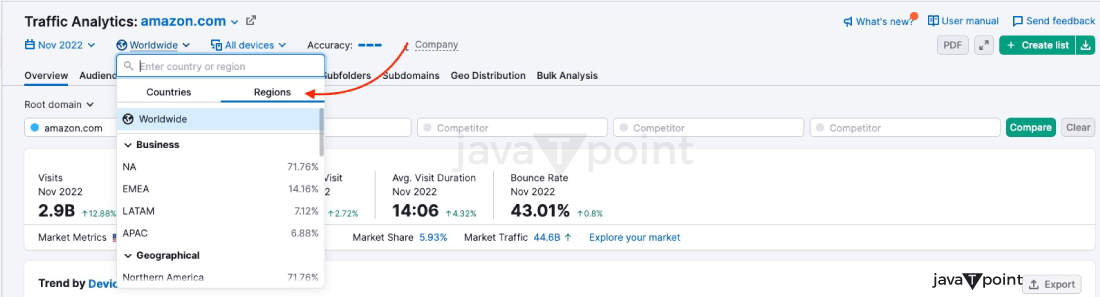
You may decide whether you require the data for Desktop, Mobile, or All Devices using the Devices filter: 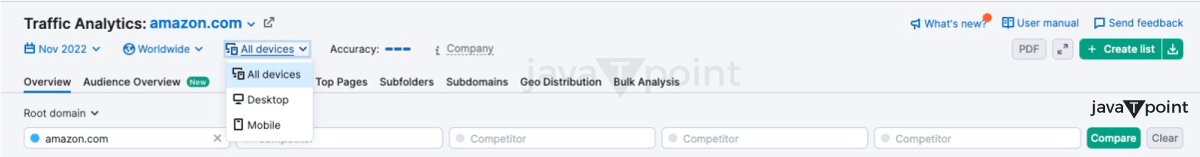
Some widgets in the Audience Overview report, however, only display statistics for all devices: 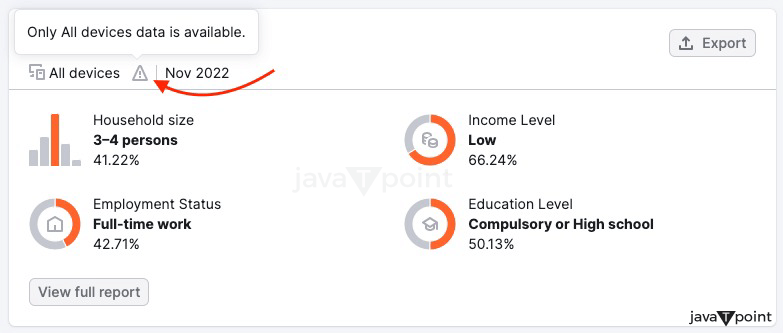
Report on Traffic Analytics Overview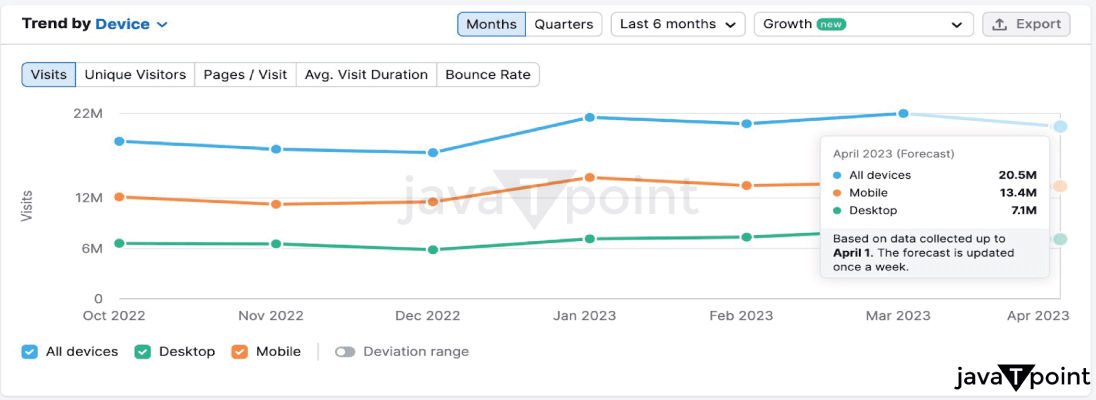
With the help of the Traffic Analytics Overview report, you can estimate the traffic to any website and compare up to 5 websites at once to understand your competitors' tactics better, investigate user behavior, and identify trends in your target market or specialty. Summary MetricsThe report opens by estimating the traffic and interaction on the questioned website. A set of bars beside the top filters indicates the report's estimated accuracy. Estimating clickstream data for a domain depends on several factors, such as the size of the domain, applied filters like historical data, location, and device, and a sample of clickstream data. A visitIt shows an estimate of the website traffic for the selected month. Unique visitorsIt approximates the number of individuals who visited the website within the given month and did not visit again during that period. Pages/VisitIt refers to the average number of pages a visitor will likely view during a single session on the website. Average Visit Durationan estimate of the typical length of each visit to the site Bouncing Rate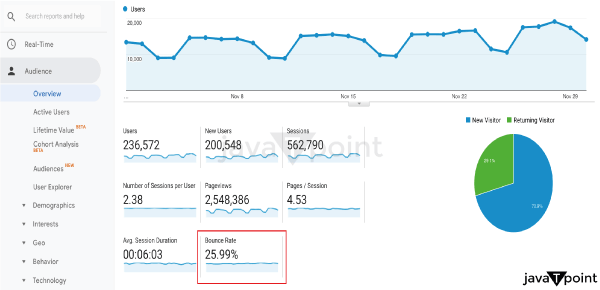
This metric shows the average bounce rate or the percentage of visitors who leave after viewing only one page on the website. The numbers next to the metrics are color-coded in red or green to indicate their change from the previous month. The graph below the metrics displays the historical traffic volume patterns for the analyzed domain. It includes data on desktop traffic, mobile traffic, and traffic from all devices. The graph may be switched between the device and the period. A domain's trend for total visits, unique visitors, pages seen per visit, average visit time or bounce rate may all be changed using the graph. On the graph, historical data is represented by a deeper shade, while predicted data, which projects the expected performance for the current month, is represented by a lighter shade. Weekly forecast updates are based on the month's performance to date. Place your mouse over the line showing the prediction you wish to learn more about to get more details, such as the detailed traffic data that is currently projected and specific metrics. The graph can provide insights into the overall performance of the company's website and seasonal trends. It can help identify spikes in traffic related to marketing campaigns or other factors that warrant further analysis. 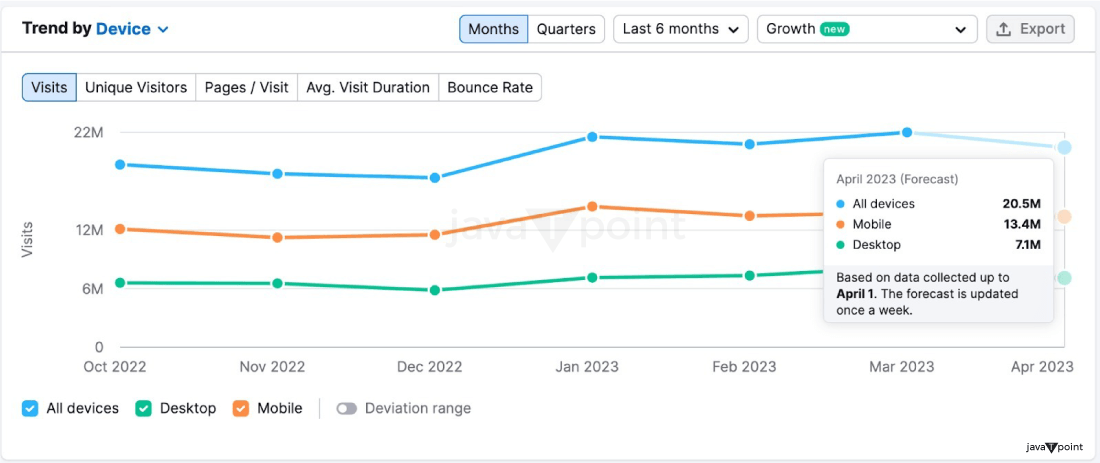
You may view our predictions' high and low values for a specific month based on the data we obtained by turning on the "Deviation range" switch. 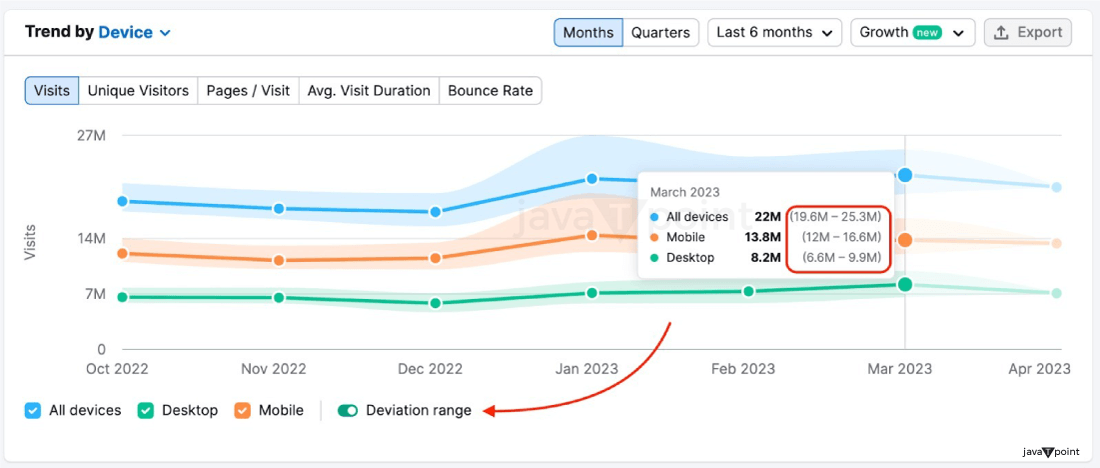
The deviation range demonstrates how accurate estimates of a particular statistic are. Estimates are more accurate when the range is smaller and less accurate when it is more significant. You may also make this widget's Growth chart active. The three-period possibilities are Month, Year Over Year, and Quarter Over Quarter. 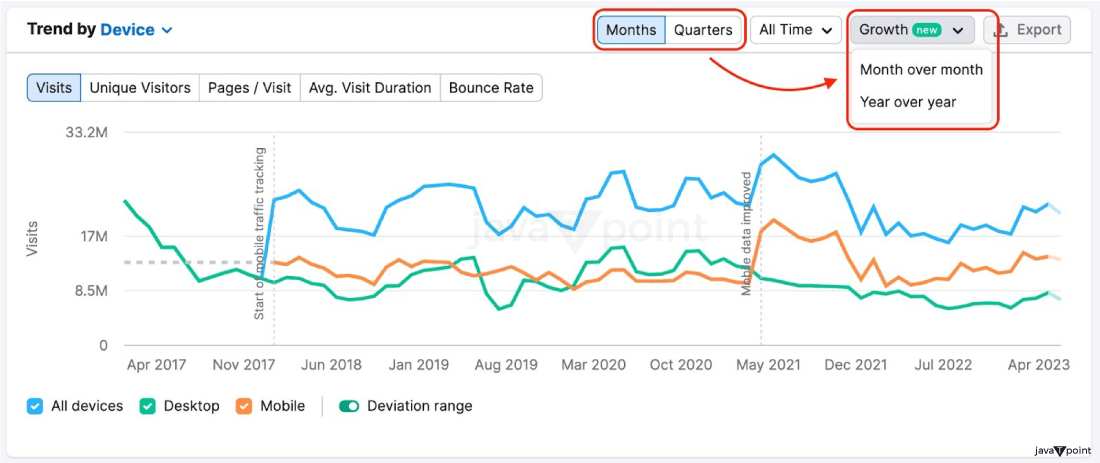
This function makes comparing changes with the prior period for each statistic and device simple. 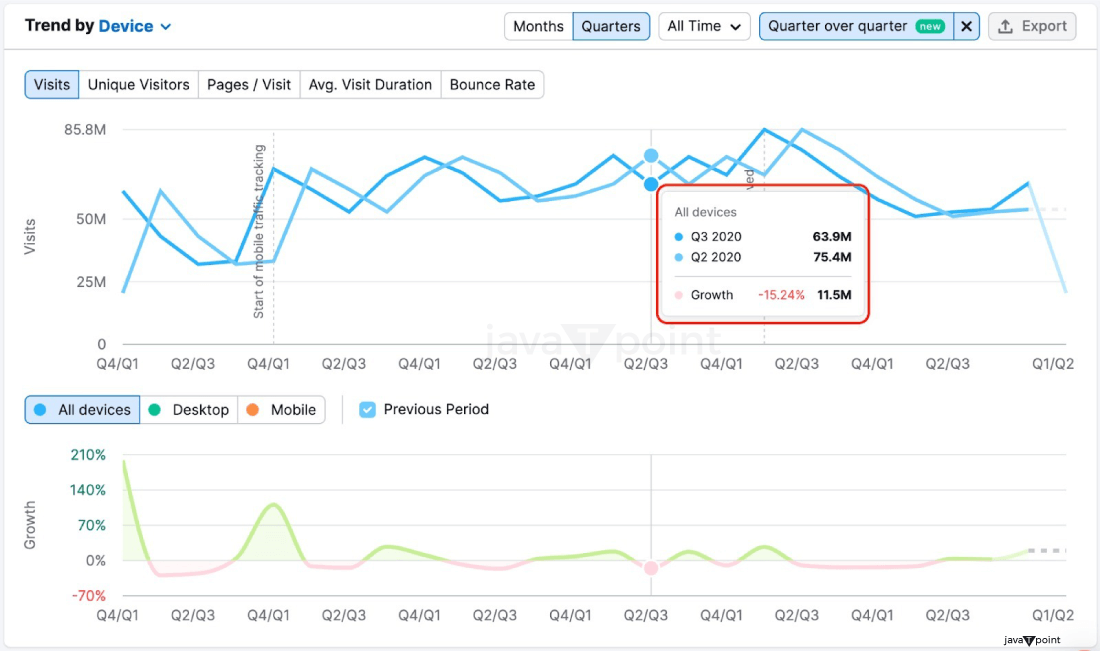
To download any of the Trends widget's graphs as a PNG or CSV file, click "Export." 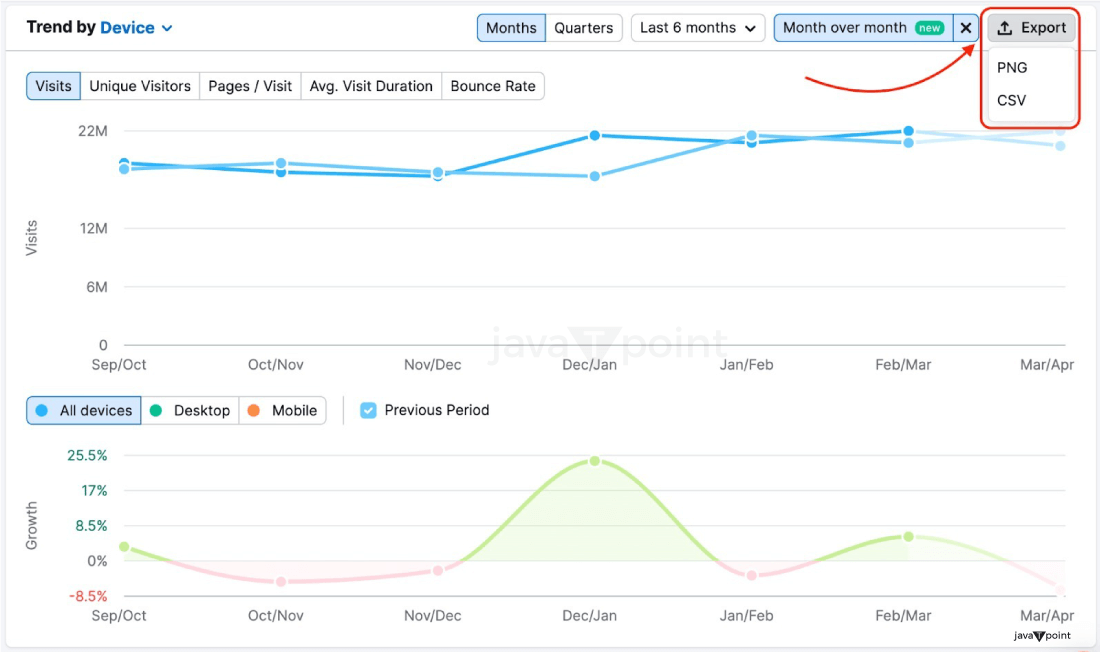
The following widget displays the domain's top pages, subfolders, and subdomains. 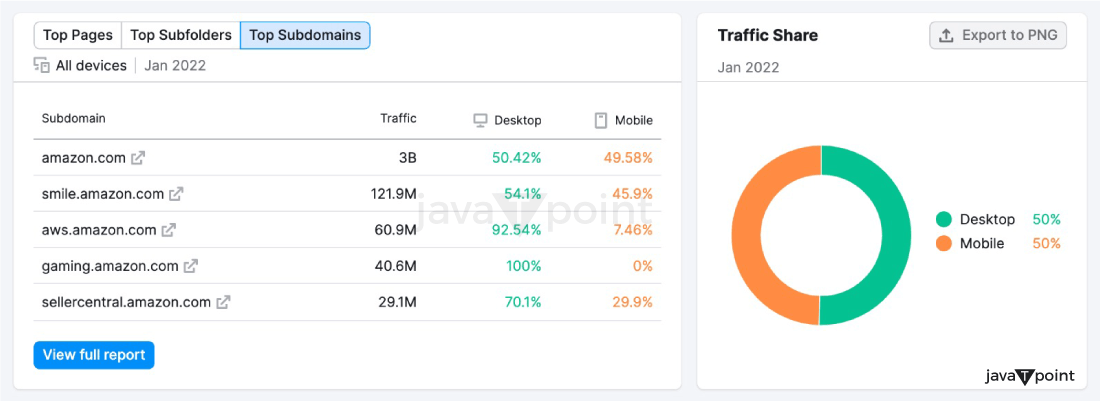
By selecting the one you wish to view, you may switch between each of these charts. The Traffic Share graph, which contrasts the proportion of traffic from desktop vs. mobile devices, is located next to that. Top Pages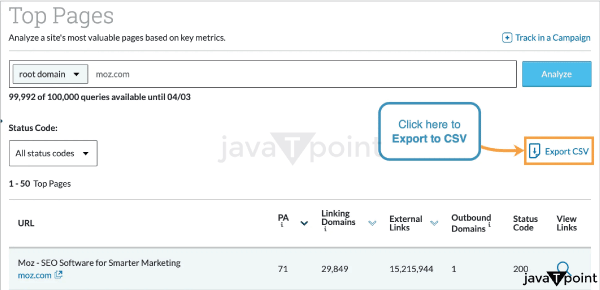
These are the top five pages on the website under analysis in terms of projected monthly unique pageviews and visits. Top Subfolders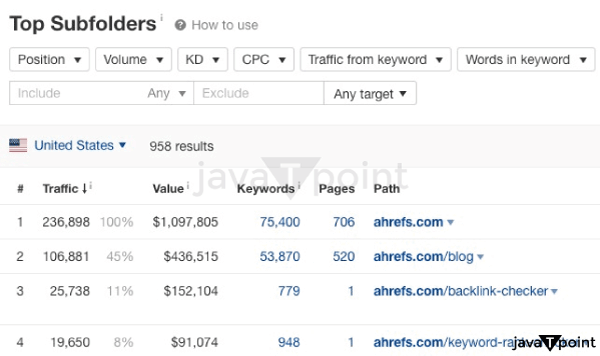
According to traffic share, these are the top five subfolders on the website under study. The projected number of unique visitors and pageviews for each page in that subdirectory is also displayed in this table. The Top Subdomains
According to projected traffic, these are a website's top five most used subdomains. The total traffic for each subdomain is shown in this table, along with the percentage of traffic that originates from desktops vs. mobile devices (color-coded to match the Traffic Share graph). The Traffic Sources table shows how much traffic was brought in from each of the five source categories: direct, referral, organic social media, organic search, paid social media, email, and display advertisements. If you utilize Trends, you can see this information by Type or by Time Period. The Meaning of each Source of Traffic is Described below 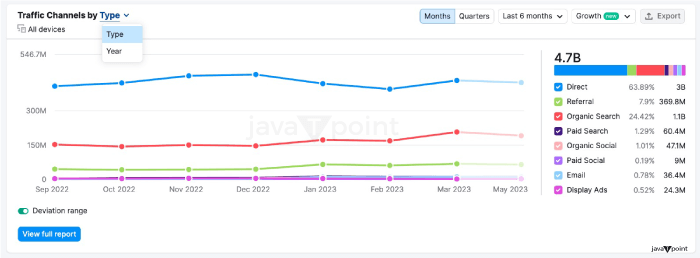
Display Advertisements
Traffic is brought to a domain via a display or video advertisement funded by ad networks like GDN or double click. The Traffic Sources by Type graph, which can be seen in Traffic Trends, shows both historical trends (shown by a deeper shade) and a projection of the predicted performance for the current month (represented by a lighter shade). Weekly updates are made to forecasts, which are based on the current month's performance. 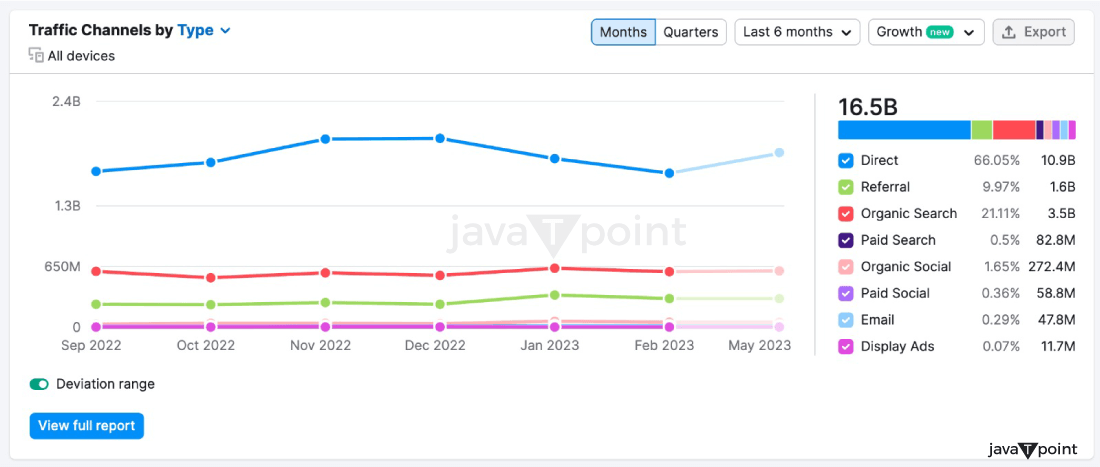
The same options are available to enable the deviation range and growth chart in Traffic Sources as in the Trend widget. You may export the graphs as a PNG or CSV file and compare changes with the previous period for each traffic source. The top 5 external domains that users most commonly visit after visiting the studied site are shown below, along with the traffic sources driving the most traffic to that domain. 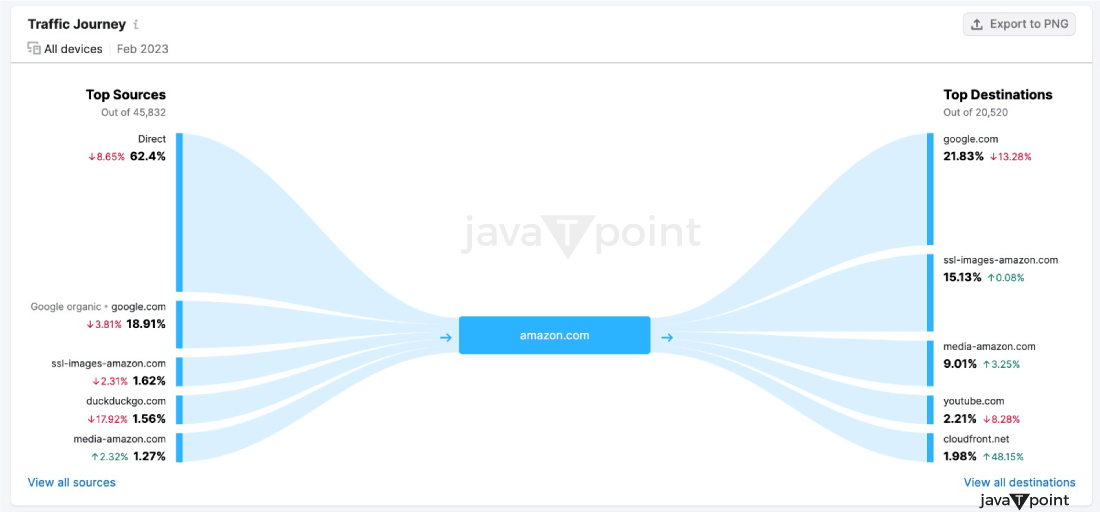
The next section of Traffic Distribution lists the business and geographic areas with the most significant domain visitors. The proportion of mobile traffic to desktop traffic for any nation or area will be displayed next to its name. 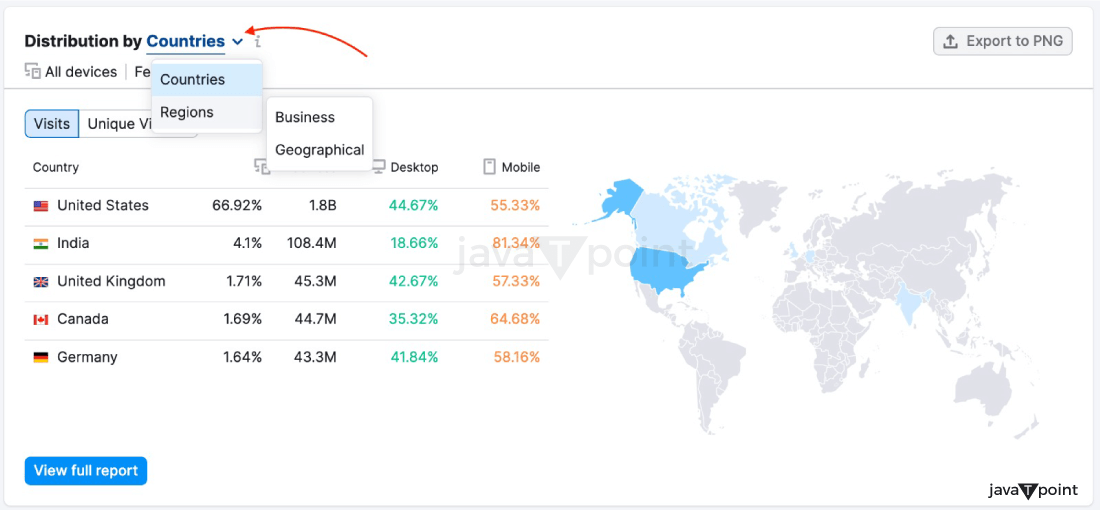
You may examine the whole list in the Geo Distribution report and use other filters-trends solution. Compare your Website to the Competition
There are several excellent ways to compare the traffic data of other websites using traffic analytics. To compare multiple websites, input their domain names in the search fields at the top of the Overview report's top. Then, click on the "Compare" option. You can maintain a list of multiple domains you can access anytime to check them frequently. The reports of every tab will be updated to include data for all domains on the list. One may create a list in a variety of ways. To create a list, use the "Create List" option on the Traffic Analytics homepage. Make a list after looking at a domain on any of the Traffic Analytics tabs. Use a list from Market Explorer or EyeOn by selecting the upload icon. Along with root domains, you may compare subdomains and subfolders in the Overview report. Below, the selected domains are compared, with estimates of their visits, visitors, visit duration, bounce rate, etc. A specific color in the reports will represent each website. Each website will have a colored line plotted on a line graph, with a darker line representing past patterns and a brighter line representing performance for the current month. Weekly forecast updates are made. This graph may be changed to show the number of unique visitors, the average visit length, and the bounce rate. The widgets for Traffic Sources, Traffic Journeys, and Geographic Distribution are below the line graph. These widgets provide an estimate of the monthly traffic for each website from different sources. The Traffic Sources widget compares the volume of visitors that each website receives from eight different traffic sources. Each website is assigned a specific color, and you can exclude them from the comparison by unchecking the boxes next to their names. With this comparison, it's easy to see the strengths and weaknesses of each website across various channels. You can find the Historical Data filter at the top of the Overview report, which you can use to adjust the focus of the analysis. It allows you to modify the month and year you want to examine. To analyze the traffic flow to each domain, the Traffic Journey chart is an excellent tool. It visually represents the traffic distribution and lets you quickly identify which sources drive the most traffic to each site. You can customize the graphs by selecting the device and period using the filters at the report's top. Last but not least, the Traffic by Countries widget displays the top 5 countries from which traffic is sent to the primary website of your choice and the approximate amount of traffic other websites in your comparison are expected to get from these countries. It may show you which websites are more prevalent in distinct local marketplaces and where rival businesses are performing better than one another. Look at the competition between bmw.com and Mercedes-benz.com in the example below. The Historical Data filters are also available here. Company Information
Information about a company can be found at the bottom of the overview report, including its sector, location, personnel, financial status, and founding date. Crunchbase powers this data and is available to all paying users. Mode of Pitch
Pitch Mode is an additional Traffic Analytics view that simplifies Semrush Traffic Analytics data presentation. This view is helpful when you want to avoid overwhelming clients, coworkers, or prospects with unnecessary information like Semrush's top or left menu. By eliminating the Semrush menus and hyperlinks, Pitch Mode will make your device's display more straightforward and distract-free. Use this mode to design an eye-catching dashboard on a screen or to present your findings to a user or colleague. To exit pitch mode, use the Esc key on your keyboard. Report on Traffic Analytics's Audience Overview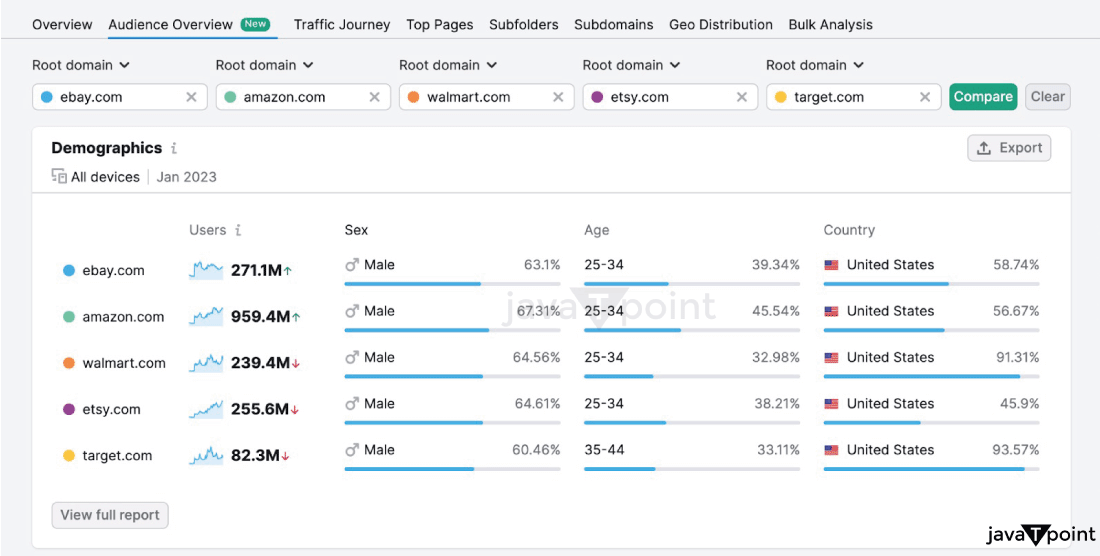
You may use the Audience Overview page to evaluate the audiences of any websites you want. This paper will help you comprehend the following:
The One2Target tool includes a comprehensive report for each widget, offering additional details, even though all widgets in the Audience Overview provide generic data. The "View full report" button gives you access to it. In the Audience Overview report, you can compare up to five domains. Once you enter the domains, you'll see the Demographics graph, which provides a breakdown of the age, gender, and primary country of origin of the audience for each domain. Following this, you can view a graph of socioeconomics which displays the audience information for each website, including the household size, job status, income level, and level of education. In the top menu of the report, you can choose between desktop, mobile, and all devices and select the period you wish to view. Please be aware that some widgets in this report will only show data for "All devices," and the report will only display data for one particular country. Below, the Behavior widget displays the preferred social media platforms, device types, and primary interests of the chosen domains' audiences based on their popularity. Next, you will find the Audience Overlap graph, which displays how each domain's audiences overlap. The Audience Overview report's top menu lets you choose between desktop, mobile, and all devices traffic and select the time frame (month and year). Most Commonly Asked QuestionsQuestion 1: How can we obtain information about website traffic? Do we comply with the privacy and security policy? Answer: Traffic Analytics ' insights are presented based on petabytes of clickstream data gathered from several proprietary and third-party data sources. Semrush's unique AI system gathers, purifies, and analyses the raw data to provide a precise picture of the online activities and routes of over 200 million authentic but anonymous internet users. To learn more about traffic data, check out the article "How Semrush Transforms Traffic Data into Traffic Intelligence." Question 2: How can I monitor website traffic? Answer: Google Analytics may be used to track website traffic. It is an internal service made for analyzing the traffic to your website. On the other hand, our website traffic checker is a third-party tool for researching the website data of other businesses. Traffic Analytics is the next best thing, as it is impossible to see the internal statistics of other websites. Question 3: Why do certain websites have limited or no data returned by Traffic Analytic? Answer: We need more website statistics to provide reliable estimates if a website receives a small number of monthly visitors. If there is a lack of data, see whether additional data is available for a different location, device, and time frame. Depending on these characteristics, the Estimated Accuracy level can change. Question 4: Why are the traffic figures displayed by Domain Analytics and Traffic Analytics different? Answer: Because Domain Analytics and Traffic Analytics base their insights on separate data sets, you can observe different website statistics in each. The estimates made by Domain Analytics are based on keyword placements and the traffic those keywords are expected to generate (search volume times typical CTR). While this happens, Traffic Analytics' estimates are based on examining clickstream data from all traffic sources, not just search. Question 5: Why should you employ this device? Answer: A tool for discovering any website's traffic tactics and accomplishments is traffic analytics. The subreports (tabs) that make up this report are Traffic Overview, Audience Overview, Traffic Journey, Top Pages, Subfolders, Subdomains, Geo Distribution, and Bulk Analysis. These studies' data provide rapid analyses and in-depth examinations of the market and competitive landscape. The following section will provide additional information on each subreport. Analytics Reports and Features for Traffic
Next TopicSemrush Course
|
 For Videos Join Our Youtube Channel: Join Now
Feedback
- Send your Feedback to [email protected]
Help Others, Please Share


