| |

Data Interpretation QuestionsIn mathematics, Data Interpretation refers to analyze, interpret, and make decisions out of a collection of data that has been processed. It is usually presented in various forms like tabular form, bar graphs, line charts, and other similar forms and hence requires an interpretation of some type. In this tutorial, we will learn about data interpretation with the help of some major techniques and examples. These are the given type of questions based on Data Interpretation Questions based on Tabular Form1. Read the following table carefully and answer the questions. The given tables show the total population of 6 different cities and the ratio of literate to illiterate population and the percentage of graduates out of the literate population in each city.
Question 1) Graduate population of city Q and R together is approximately what percent more or less than the graduate population of city P and T together? Explanation: Graduate population of the city P and T together 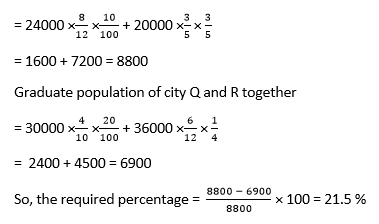
Question 2) The population of city R who are literate but not graduate is how much more than the average graduate population of city S and T together? Explanation: The population who are literate but not graduate of city R 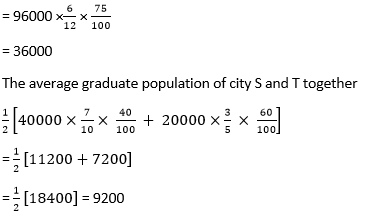
So, the required difference = 36000 - 9200 = 28800 Question 3) If the ratio of illiterate males to females in city q is 3:2 and the ratio of graduate males to the female population in city S is 4: 6. Find the ratio of total illiterate male in city Q and graduate female in city S Explanation: Illiterate male in city Q 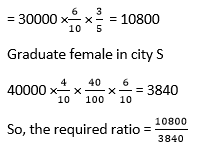
2. The table below shows the number of laptops sold by the 5 sellers and the ratio of Lenovo laptops sold to Sony laptops sold. Read the data carefully and answer the given questions.
Question 1) The Lenovo laptop sold by P seller is what percent less than Lenovo laptop sold by Q seller. Explanation: 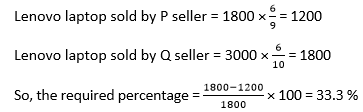
Question 2) Find the average number of Sony laptop sold by seller Q, R, and S all together? Explanation: Required Average = 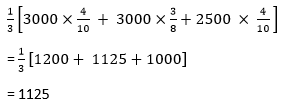
Question 3) Find the ratio of Lenovo laptop sold by 'R' to Lenovo laptop sold by 'T '? 
Question 4) Sony laptop sold by S and T together is how much less than Sony laptop sold by Q and R together? Explanation: Sony laptop sold by S and T together 
= 1500 + 800 = 2300 Sony laptop sold by Q and R together 
= 1200 + 2000 = 3200 Required difference = 3200 - 2300 = 900 Questions based on Missing number1. The table given below shows the number of products sold by 5 shopkeepers on five different days.
Note: Some data are missing in the above table; calculate the missing data if required.Question 1) If the total product sold by P and Q, including all five days, is 1800 and 2000 respectively, the product sold by Q on Tuesday is what percent more/less than the product sold by P on Friday? Explanation: Product sold by P on Friday = 1800 - (360 + 240 + 580 + 380) = 1800 - 1560 = 240 Product sold by Q on Tuesday = 3200 - (220 + 550 + 660 + 420) = 2000 - 1850 = 150 So, the required percentage 
Question 2) If the ratio of products sold by Q and R together on Thursday to products sold by R and S together on the same day is 3: 1, find the product sold by R on Thursday? Explanation: Let item sold by R on Thursday be a. According to question 
660+a = 3a + 390 2a = 270 a = 135 Question 3) What is the difference in the product sold by P on Monday and Friday. If total products sold by P is 2000? Explanation: Product sold by P on Friday = 2000 - 1560 = 440 So, the required difference = 440 - 360 = 80 Question 4) If the average of products sold by S on Monday and Tuesday is 260, then the products sold by S on Monday is what percent of the product sold by T on Friday? Explanation: Products sold by S on Monday = 2 260 - 270 = 520 - 270 = 250 Required percentage = 
2. The table below shows the population of five cities and the percentage of male, female, and transgender people.
Question 1) Total number of females in village 'Q' and 'S' together is what percent more than the total number of males in village 'R'? Explanation: Total number of females in village 'Q' and 'S' together 
= 4500 + 4800 = 9300 The total number of males in village 'R' 
Question 2) What will be the difference between the number of males and females in Village 'P'? Explanation: Required difference 
Question 3) Find the difference between female in village 'S' to males in village 'T' ? Explanation: 
= 4800 - 1600 = 3200 Question 4) Transgender population in village 'P' is what percent of the female population in Village 'Q' ? Explanation: Required % 
= 45 % Questions based on Bar GraphThe bar graph is given below shows the per gram rate of Carbon and Oxygen on various days. Read the data carefully and answer the given question. 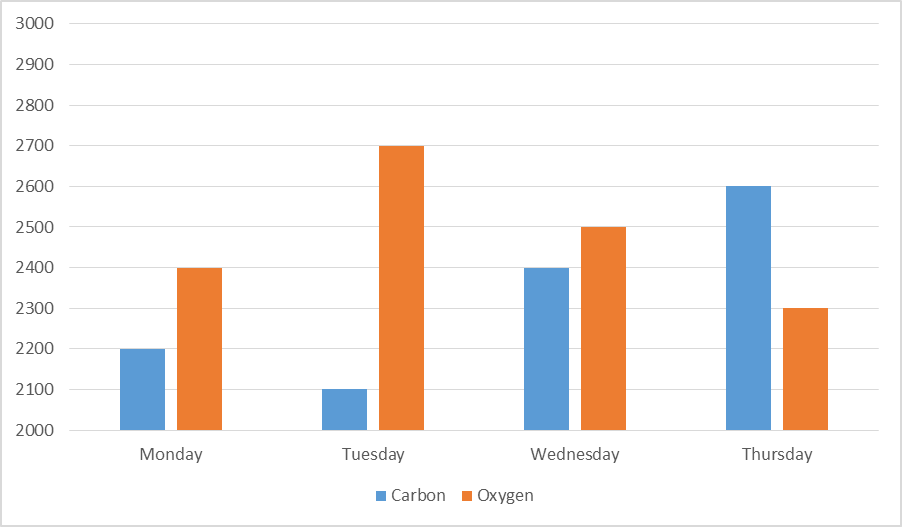
Question 1) Peter buy 5 grams of Oxygen on Tuesday and 8 grams of Carbon on Wednesday. Find the total amount paid by him? Explanation: Required amount = 2700 5 + 2400 8 = 13500 + 19200 = 32700 Question 2) Average per gram price of Oxygen on all four days together is how much more than the average per gram price of Carbon on all four days together? Explanation: Average per gram price of Oxygen on all the four days 
= 2475 Average per gram price of Carbon on all the four days 
= 2325 So, the required difference = 2475 - 2325 = 150 Question 3) On Friday, per gram price of both Carbon and Oxygen increased by 20% and 25%, respectively, compared to the price on Thursday. Find the sum of peer gram price of Carbon and Oxygen on Friday? Explanation: Required amount 
Question 4) What is the ratio of per gram price of Carbon and Oxygen together on Monday to that on Thursday? Explanation: Required ratio 
Question 5) Jhon bought 4 grams of both Carbon and Oxygen on Wednesday and sold it on Thursday at the given price. Find the total amount lose by him? Explanation: = 4 [2600 - 2400 +2200 - 2500] = 4 [-100] = 400 2. A Company delivers three different items, namely, food, drinks, and Cosmetics. If the company's total production was the same for all years and % production of three products in the particular year given below, answer the given question. 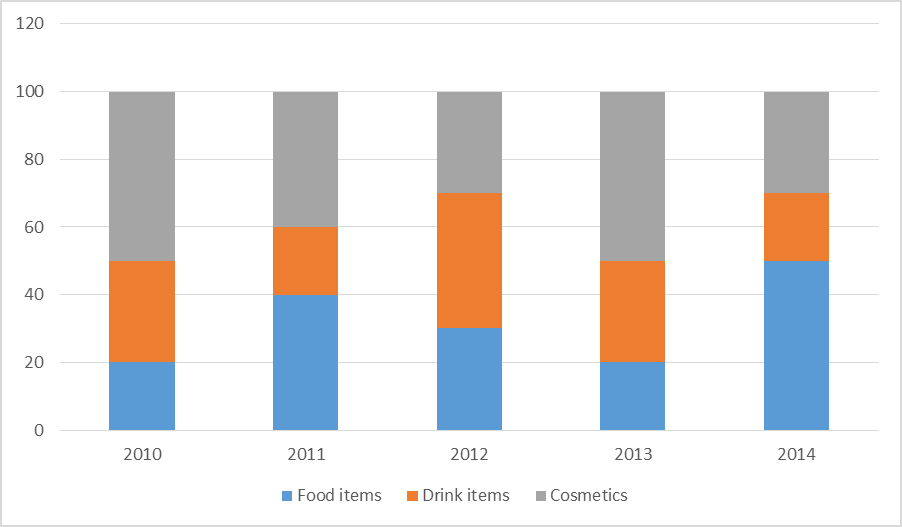
Question 1) In 2010, the number of food items produced by the company is what percent more or less than cosmetic items produced in the year 2013? Explanation: Let's suppose the total production of the company to be K So, the required percent = 
= 39 % less Question 2) If production in the year 2014 was 1,40,000. Find the difference between the number of food items produced in 2014 and drink items produced in 2011? Explanation: Required difference 
= 70000 - 28000 = 42000 Question 2) Find the ratio between the number of cosmetic items produced in 2014 and the number of food products produced in 2010. Explanation: Let's suppose the total production of the company to be K So, the required ratio = 
Question 3) The difference between food items and drink items produced by the company in 2011 is 20000. Find the average of food and cosmetic items produced by the company in 2010? Explanation: Let's suppose total production of the company be K According to question, 20% of k = 20000 
K = 100000 So, the required average = 
= 20000 + 50000 / 2 = 70000/2 = 35000 Question 4) Find the total production in 2015 if there is an increase of 20% in total production in 2018 compared to the previous year given that the number of drink items produced in 2012 was 16000? Explanation: Let's suppose the production of each previous years be K According to the question, 40% of k = 16000 
K = 40000 So, the total production in 2015 
= 48000 Caselet Data Interpretation1. The total number of TV sold by a store in January and March is 1800, and the total number of TV sold in January is 40% more than that of in March. The store sold TV of only 4 brands that are LG, Sony, Samsung, and MI. 20% of total TV sold by the store is Sony, and the total number of Sony TV sold by a store in March is 25% less than that of Sony TV sold by a store in January. The number of MI TVs sold by a store in January is 30% more than that of the total Sony TV sold by the store in January. The total number of Samsung TVs sold by a store in January is 20% less than the total LG TV sold by a store in March is 20% more than that of total LG TV sold by a store in January. The total number Of MI and Samsung TVs sold in March is 7:4. Question 1) Total Samsung TV sold by a store in January is what percent more than total MI sold by a store in March? Explanation: 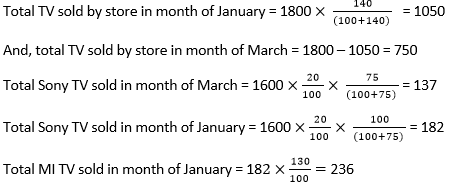
Let total number of LG TV sold in month of January = k So, the total number of Samsung TV sold in moth Of January = 0.8k According to question, K + 0.8k = (1050- 182-236) = 1.8k = 632 = k = 351 The total number of LG TV sold in January = 351 The total number of Samsung TV sold in January = 0.8 × 351 = 280 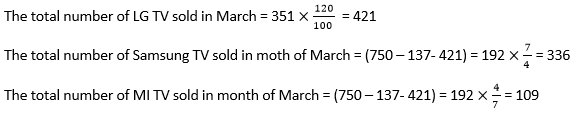

= 156% Question 2) Find the ratio between total Sony TV sold by a store in January to total MI TV sold by a store in March? Explanation: 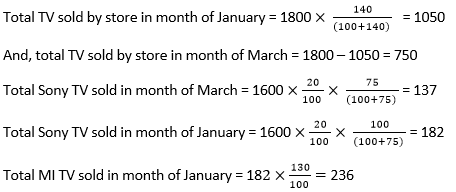
Let total number of LG TV sold in month of January = k So, the total number of Samsung TV sold in moth Of January = 0.8k According to question, K + 0.8k = (1050- 182-236) = 1.8k = 632 = k = 351 The total number of LG TV sold in January = 351 The total number of Samsung TV sold in January = 0.8 × 351 = 280 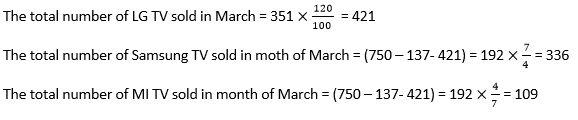
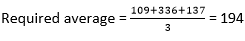
Required ratio = 182/109 Question 3) Find the average number of MI, Samsung, and Sony TV sold by a store in March? Explanation: 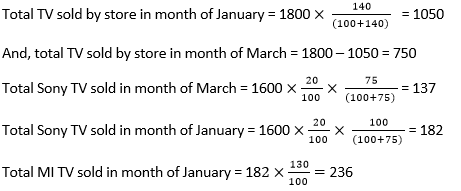
Let total number of LG TV sold in month of January = k So, the total number of Samsung TV sold in moth Of January = 0.8k According to question, K + 0.8k = (1050- 182-236) = 1.8k = 632 = k = 351 The total number of LG TV sold in January = 351 The total number of Samsung TV sold in January = 0.8 × 351 = 280 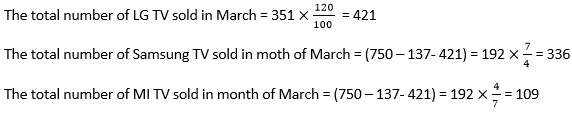
Question 4) Total Samsung TV sold by a store in January is what percent less than total LG TV sold by a store in March? Explanation: 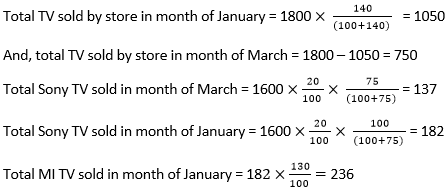
Let total number of LG TV sold in month of January = k So, the total number of Samsung TV sold in moth Of January = 0.8k According to question, K + 0.8k = (1050- 182-236) = 1.8k = 632 = k = 351 The total number of LG TV sold in January = 351 The total number of Samsung TV sold in January = 0.8 × 351 = 280 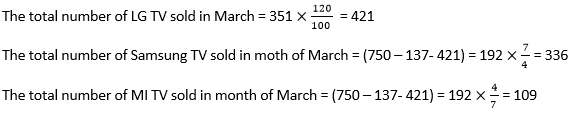
Required percentage 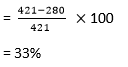
Question 5) Find the difference between the total LG TV sold by a store in both months and the total Samsung TV sold by a store in both months? Explanation: 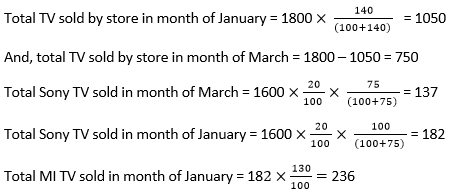
Let total number of LG TV sold in month of January = k So, the total number of Samsung TV sold in moth Of January = 0.8k According to question, K + 0.8k = (1050- 182-236) = 1.8k = 632 = k = 351 The total number of LG TV sold in January = 351 The total number of Samsung TV sold in January = 0.8 351 = 280 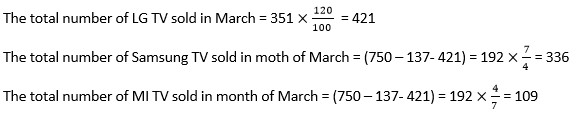
Required difference = (351 + 421) - (280+336) = 772 - 616 = 156 2. On a particular day, the total number of people who went to a club for the party is 75% of the total capacity of the club. There is a total four-bar available there, and each has an equal capacity of 400. 25% of people have drunk in bar 1 and 20% remaining drunk in bar 4. The number of people who have drunk in bar 2 is 40% more than of bar 3. The number of males and females who have drunk on that particular day is 3: 5. Question 1) If in bar 1 the ratio of the number of males to that of female was 4:3, and in bar 4, the ratio of female to male was 9:7, find the total number of females who have drunk in these two bars is what percent of the total number of females who have drunk on that particular day? Explanation: Total capacity of the club = 400 × 4 = 1600 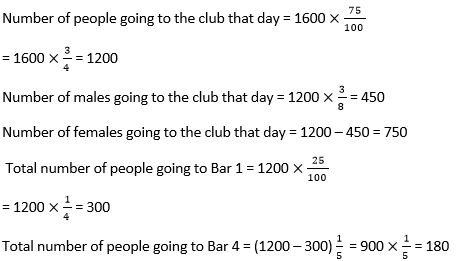
Let's the number of people who have drunk in bar 3 be 100x then number of people in bar 2 be 140x According to question, 100x + 140x = (1200 - 300 - 180) = 720 
So, the total number of people in bar 3 = 100 × 3 = 300 and the total number of people in bar 2 = 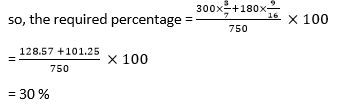
Question 2) Find the difference between the total number of males who have drunk on that day and the number of people who have drunk in bar 2 and bar 4 together? Explanation: Total capacity of the club = 400 × 4 = 1600 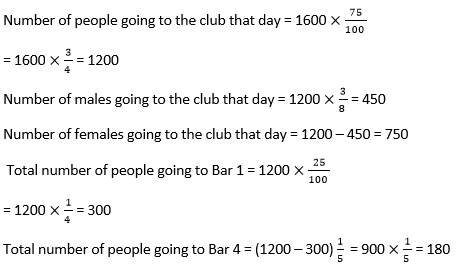
Let's the number of people who have drunk in bar 3 be 100x then number of people in bar 2 be 140x According to question, 100x + 140x = (1200 - 300 - 180) = 720 
So, the total number of people in bar 3 = 100 × 3= 300 and the total number of people in bar 2 = 140 × 3 = 420 Required difference = (420 + 180) - 450 = 600 - 450 = 150 Question 3) Find the ratio of the average number of people who have drunk in bar 1 and bar 3 to the average of the people who have drunk in bar 2 and bar 4. Explanation: Total capacity of the club = 400 × 4 = 1600 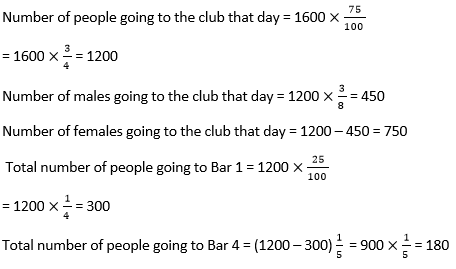
Let's the number of people who have drunk in bar 3 be 100x then number of people in bar 2 be 140x According to question, 100x + 140x = (1200 - 300 - 180) = 720 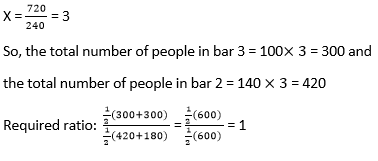
Question 4) The number of people who have drunk in bar 3 is what percent of the total capacities of Club? Explanation: Total capacity of the club = 400 × 4 = 1600 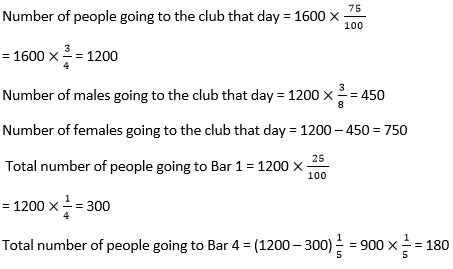
Let's the number of people who have drunk in bar 3 be 100x then number of people in bar 2 be 140x According to question, 100x + 140x = (1200 - 300 - 180) = 720 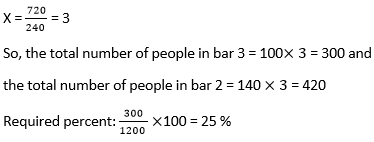
Question 5) The cost of an entry ticket is Rs. 350, but there was a discount of 20% for females and 10% for male people on that day. Find the total income earned by the club on that day? Explanation: Total capacity of the club = 400 × 4 = 1600 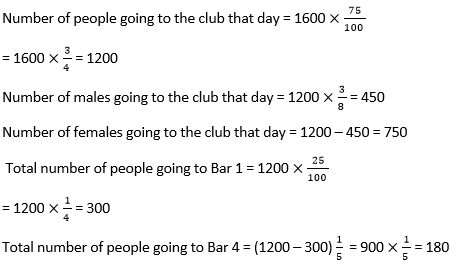
Let's the number of people who have drunk in bar 3 be 100x then number of people in bar 2 be 140x According to question, 100x + 140x = (1200 - 300 - 180) = 720 
So, the total number of people in bar 3 = 100× 3= 300 and the total number of people in bar 2 = 140 × 3= 420 On that day, 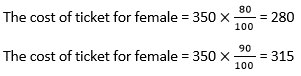
Total income earned by the club on that day =(750×280 + 450×315) = (210000 + 141750) = Rs. 351,750 3. The total population of Noida sector 3 is 30000, and there are three sectors: P, Q, and R. The ratio of the population of their sectors (P:Q: R) is 7:5:3. The number of males in sector P is 5000 more than that of females in sector R. Ratio of numbers of females in sector P to that if males in sector R is 7:3. The number of females in sector Q is 60% of the number of males in sector P. Question 1) Find the average number of males in sector P and Q is how much more and less than the number of females in sector P? Explanation: 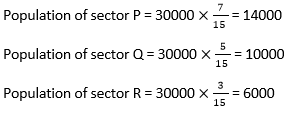
Let number of females in sector P and number of males in sector R be 7x and 3x respectively Number of males in sector P = (14000 - 7x) Number of females in sector R = (6000 - 3x) According to question, (14000 - 7x) - (6000 - 3x) = 5000 =14000 -7x -6000 + 3x = 5000 = 8000 -4x = 5000 X = 750 Number of females in sector P = 7 ×750= 5230 Number of males in sector P = 14000 = 8770 Number of males in sector R = 3×750= 2250 Number of females in sector R = 6000 - 2250 = 3750 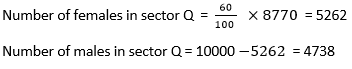

= 6754 - 5230 = 1524 Question 2) The total male population of P and R sectors is what percent of the total population of these two sectors? Explanation: 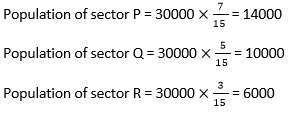
Let number of females in sector P and number of males in sector R be 7x and 3x respectively Number of males in sector P = (14000 - 7x) Number of females in sector R = (6000 - 3x) According to question, (14000 - 7x) - (6000 - 3x) = 5000 =14000 -7x -6000 + 3x = 5000 = 8000 -4x = 5000 X = 750 Number of females in sector P = 7 ×750 = 5230 Number of males in sector P = 14000 -5230 = 8770 Number of males in sector R = 3×750 = 2250 Number of females in sector R = 6000 - 2250 = 3750 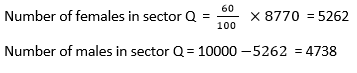

Question 3) Find the ratio of the total number of females in all sectors to that of the total male population in all sectors? Explanation: 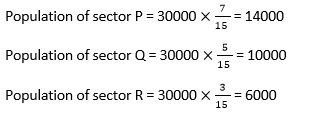
Let number of females in sector P and number of males in sector R be 7x and 3x respectively Number of males in sector P = (14000 - 7x) Number of females in sector R = (6000 - 3x) According to question, (14000 - 7x) - (6000 - 3x) = 5000 =14000 -7x -6000 + 3x = 5000 = 8000 -4x = 5000 X = 750 Number of females in sector P = 7 ×750 = 5230 Number of males in sector P = 14000 -5230 = 8770 Number of males in sector R = 3×750 = 2250 Number of females in sector R = 6000 - 2250 = 3750 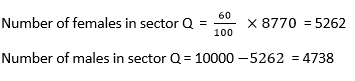

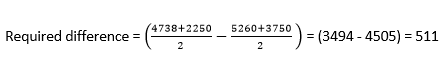
Question 4) The average male population of sectors Q and R is how much more or less than the average female population of these two sectors. Explanation: 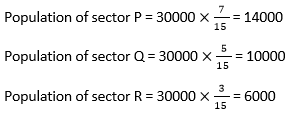
Let number of females in sector P and number of males in sector R be 7x and 3x respectively Number of males in sector P = (14000 - 7x) Number of females in sector R = (6000 - 3x) According to question, (14000 - 7x) - (6000 - 3x) = 5000 =14000 -7x -6000 + 3x = 5000 = 8000 -4x = 5000 X = 750 Number of females in sector P = 7 ×750 = 5230 Number of males in sector P = 14000 -5230 = 8770 Number of males in sector R = 3×750 = 2250 Number of females in sector R = 6000 - 2250 = 3750 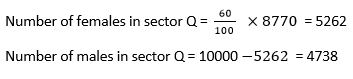
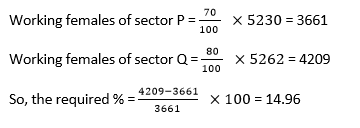
Question 5) 70% and 80% of the female sector P and sector Q respectively are working. Find the working females of Q is how much percent more or less than that of working females of A. Explanation: 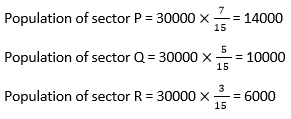
Let number of females in sector P and number of males in sector R be 7x and 3x respectively Number of males in sector P = (14000 - 7x) Number of females in sector R = (6000 - 3x) According to question, (14000 - 7x) - (6000 - 3x) = 5000 =14000 -7x -6000 + 3x = 5000 = 8000 -4x = 5000 X = 750 Number of females in sector P = 7 ×750 = 5230 Number of males in sector P = 14000 -5230 = 8770 Number of males in sector R = 3×750 = 2250 Number of females in sector R = 6000 - 2250 = 3750 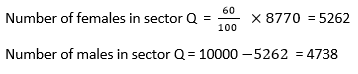
Questions based on Bar Graph1. The pie chart given below shows the percentage distribution of five village populations in Two different years (2014 and 2018). Read the given data carefully and answer the questions. 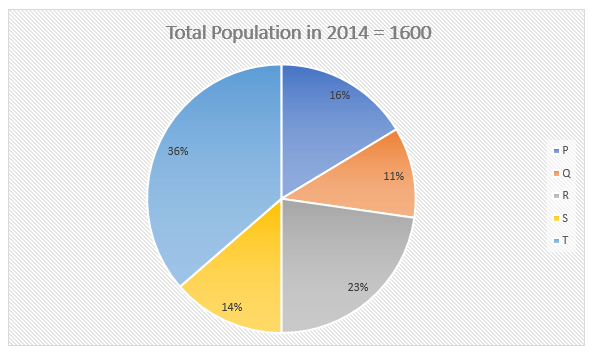
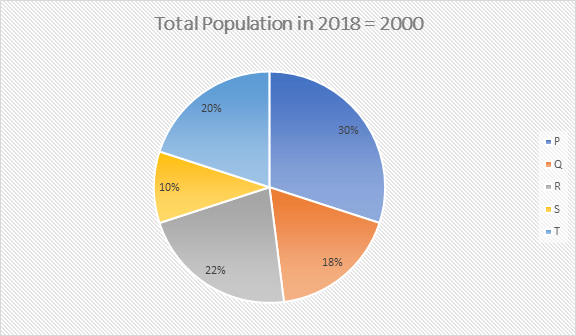
Question 1) Find increment percentage of the population of village T in the year 2014 over the year 2018? 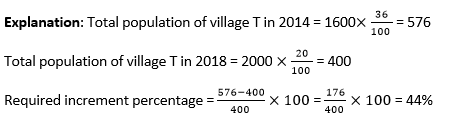
Question 2) Find the ratio between total population of village Q in year 2014 to total population of village Q and R together in the year 2018? Explanation: 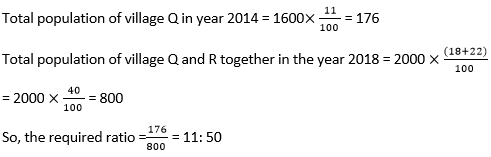
Question 3) Find the difference between population of village P in the year 2018 and Village P in year 2014? Explanation: 
= 600 - 256 = 344 Question 4) Find the average number of populations of village R in both given years? : 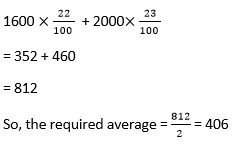
Question 5) Find the decrement percentage in the population of village S in the year 2014 over the year 2018? Explanation: 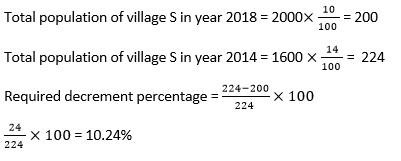
2. The pie chart shown below shows the total income of Jhon in six different months and the percentage distribution in these months. Read the data carefully and answer the given questions. 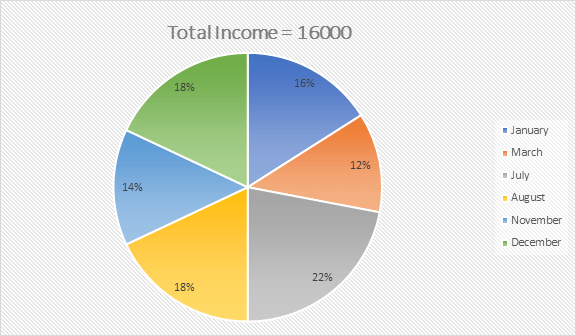
Question 1) Income of john in March and July together is what percent less than the income of john in August and December together? Explanation: Given, Income of john in the month of March and July together = 12% + 22% = 34% Income of john in the month of August and December together = 18% + 18% = 36 % 
Question 2) Income of John in July and December together is how much more than the income of john in January and March together? Explanation: Income of John in July and December together = 22% + 18% = 40% income of john in January and March together = 16% + 12% = 28% 
Question 3) Which month shows the highest percent increment in income as compared to the previous month? Explanation: We can see in the pie chart; the July month shows the highest percent increase in income as compared to the previous month, which is equal to 
Question 4) Income in November and December together makes how much central angle of the total? Explanation: Income in the month of November and December together = 18% + 14 % = 32% 
Question 5) Jhon's average income in starting four months (January, March, July, August) in the given six months (January, March, July, August, November, December) is how much less than Jhon's average income in the last four months in the given six months? Explanation: Jhon's average income in starting four months (January, March, July, August) = 
= 2720 Jhon's average income in starting four months (July, August, November, December) 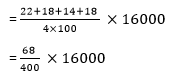
= 2880 So, the required difference = 2880 - 2720 = 160 Questions based on Line Graph1. Read the given line graph carefully and answer the questions. The Line graph shows the percentage of AC sold by six shopkeepers. 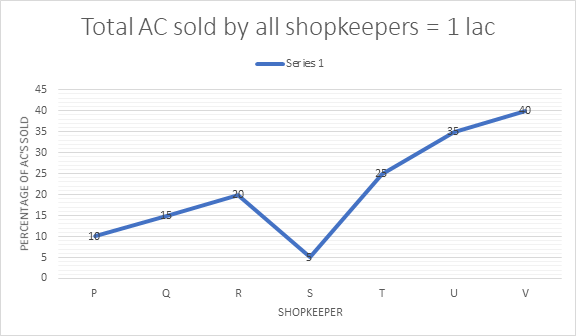
Question 1) AC's sold by shopkeeper Q and U together is how much more than AC's sold by shopkeeper P and S together? Explanation: AC's sold by shopkeeper Q and U together = (15 + 35)% = 50% AC's sold by shopkeeper P and S together = (10 + 5)% = 15% 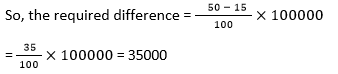
Question 2) AC's sold by shopkeeper T and V together is how much percent more than AC's sold by shopkeeper R and S together? Explanation: AC's sold by shopkeeper T and V together = (25+40)% = 65% than AC's sold by shopkeeper R and S together = (20 + 5)% = 25% 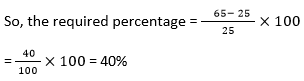
Question 3) V sold only three types of AC's that are W, X, and Y in the ratio 5:6:7. Find the difference between AC's sold by V of type W and Y together and type X? Explanation: Total AC's sold by shopkeeper V 
Question 4) What is the ratio of the average of AC's sold by shopkeepers T, R, and P together to average AC's sold by shopkeepers P and V together? Explanation: AC's sold by shopkeeper T, R and P together = 15+20+10 = 45/3 = 15 AC's sold by shopkeeper P and V together = 40 + 10 = 50/2 = 25 
Next TopicWhat is Cron Job
|
 For Videos Join Our Youtube Channel: Join Now
Feedback
- Send your Feedback to [email protected]
Help Others, Please Share


