| |

JDB ArchitectureThe Java Debugger architecture consists of three interfaces:-
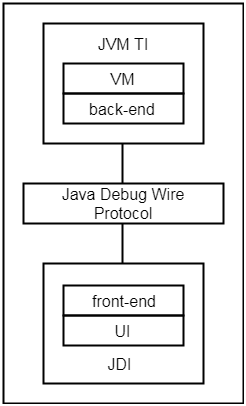
JDB Architecture JVM Tool InterfaceThe Java virtual machine tool interface (JVM TI) provides the services that virtual machine (VM) required for debugging. It examines the state and controls the execution of applications running in the JVM. It supports all the tools that need access to JVM state such as debugging, profiling, thread analysis, monitoring and coverage analysis tools. Java Debugger Wire ProtocolThe role of JDWP is to define the format of requests and information between the debugger front end and the process being debugged. Thus, it enables a communication between debugger and the JVM. It allows the debugger to work in a different process either on the same computer or on a remote computer. Although JDWP is optional. Java Debugger InterfaceJDI is the uppermost layer of Java debugger that defines the information and requests at the user code level. It has ability to control the execution of virtual machine. Apart from that, it can also suspend and resume threads.
Next TopicJDB Installation
|
 For Videos Join Our Youtube Channel: Join Now
Feedback
- Send your Feedback to [email protected]
Help Others, Please Share


