| |

|
|
|
JDB Interview QuestionsA list of top frequently asked JDB interview questions and answers are given below: 1) What is a debugger?A debugger is a computer program used to identify and remove errors from other programs. 2) What is (JBD) Java debugger?(JDB) Java debugger is a command line Java debugging tool used to debug Java programs without the requirement of inserting specific debugging instructions into the code. 3) What are the advantages of Java Debugger?These are some advantages of Java Debugger: -
4) What are some frequently generate bugs?These are some commonly generate bugs: -
5) What are the various types of Java Debugger?Several types of Java Debuggers are: -
6) What are the different approaches of debugging?Various types of approaches used for debugging are: -
7) How to connect JDB with JVM?There are various ways to connect JDB with JVM, but the simplest one is to provide the following command at the runtime of your main class: - Here, MainClass represents the name of your class. 8) What is the role of the interpreter in debugging the Java program?Java debugger interacts with the Java runtime interpreter to interrupt the normal flow of the program. Thus, Java interpreter provides support to the debugger. 9) What is the syntax used to invoke the debugger?The following syntax is required to invoke debugger: - jdb [options] [classname] [arguments] 10) How can we debug an applet?To debug an applet, we have to execute the debugger within applet viewer by the help of the following command: - 11) How to list out all the available JDB commands with their specifications?To list out all the available JDB commands with their specifications, you need to initialize JDB and type help command on the console. After the execution of help command, the following list will be generated on your console: - 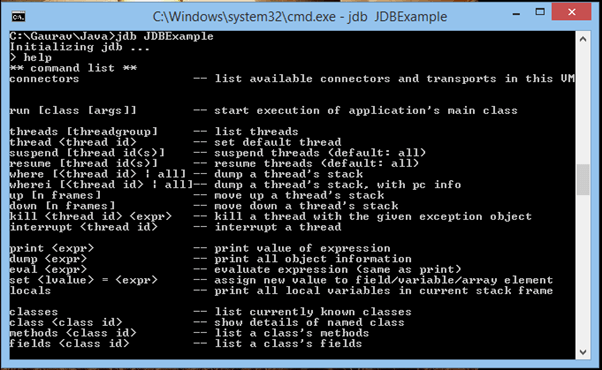
12) How can we start the execution of the main class?To start the execution of the main class, you need to execute the below command: - It is optional to mention the name of specific class and argument. 13) Which command is used to complete the remaining execution?Use the following command to complete the partial execution of the program. 14) What is the difference between print and dump command?The print command is used to display the value of expressions whereas dump command is used to display the information of objects. 15) What is the purpose of breakpoints in Java Debugger?Breakpoints are used in debugging to pause or stop the execution of a program at a specific line of code and test whether the program is functioning correctly or not. 16) What is the syntax used to set a breakpoint?A breakpoint can be set either on the basis of method name or the specific number of the line.
17) How can we set a breakpoint in an applet?Let suppose there is an applet named as Javatpoint having a method scrollDown(). To set a breakpoint on scrollDown() method, you need to follow the below command: - 18) What is stepping in Java Debugger?In JDB, Stepping is a procedure to execute the code line by line. Thus, through this approach, each line of the code can be properly examined. 19) What are the various techniques of stepping?These are the following techniques of stepping: -
20) Can we handle exceptions through JDB?Yes, Java debugger is capable of handling runtime exceptions. To handle these exceptions it provides catch command. |
You may also like:
- Java Interview Questions
- SQL Interview Questions
- Python Interview Questions
- JavaScript Interview Questions
- Angular Interview Questions
- Selenium Interview Questions
- Spring Boot Interview Questions
- HR Interview Questions
- C Programming Interview Questions
- C++ Interview Questions
- Data Structure Interview Questions
- DBMS Interview Questions
- HTML Interview Questions
- IAS Interview Questions
- Manual Testing Interview Questions
- OOPs Interview Questions
- .Net Interview Questions
- C# Interview Questions
- ReactJS Interview Questions
- Networking Interview Questions
- PHP Interview Questions
- CSS Interview Questions
- Node.js Interview Questions
- Spring Interview Questions
- Hibernate Interview Questions
- AWS Interview Questions
- Accounting Interview Questions


