| |

Pingdom ToolPingdom is a set of commonly used tools that go beyond website performance monitoring. In addition to page speed analysis, Pingdom comprises uptime monitoring, transaction monitoring, visitor insights (RUM), and server monitoring tools with an alerting system if anything goes wrong with your site. It is one of the most popular performance testing tools in the WordPress community. Pingdom is a deceptively deep webpage speed tester. Its interface is simple and easy to use. The data generated is well-organized and easy to skim or dive deep into the details. Pingdom is a great tool to provide a client-facing report while also giving your developer information specific enough to address problems. Pingdom is a Swedish website monitoring software as a service company launched in Stockholm and later acquired by Austin, owned by SolarWinds. The company releases annual reports on global internet use, which are frequently cited in academic publications and media organizations as sources of Internet-related statistics. Pingdom offers a 14-day free trial, and its website monitoring suite is available starting at $42.12 per month. Features of PingdomPingdom provides users with a nice mix of options and simplicity. And it offers the following benefits:
How to Use Pingdom ToolTo measure the site's performance using Pingdom, you need to follow the following steps: Step 1: Use your web browser to go to http://tools.pingdom.com. Step 2: In the text box, enter the URL of your site that you want to test. Step 3: If you want to test the site from a particular location, select the geographic region you want. 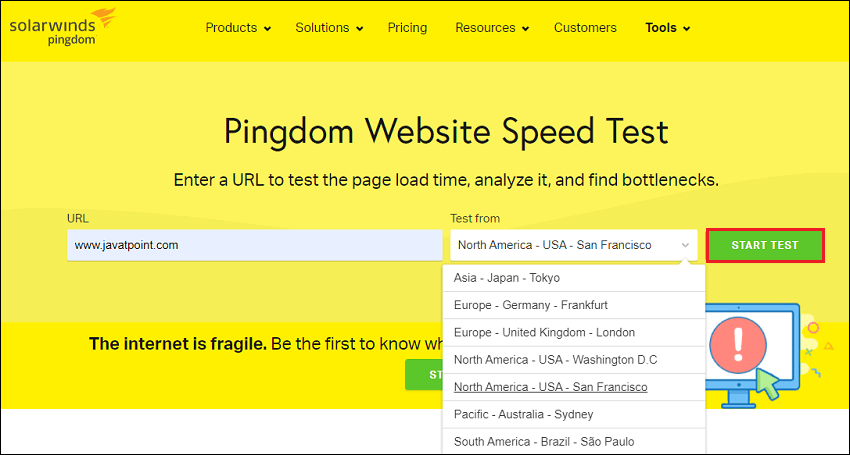
Step 4: Click on the Start Test button. After a few seconds, Pingdom analyzes how long it takes to download the page and each element on the page and then provides a waterfall chart of the entire page load process. Each downloaded resource is represented by a color bar on a timeline. 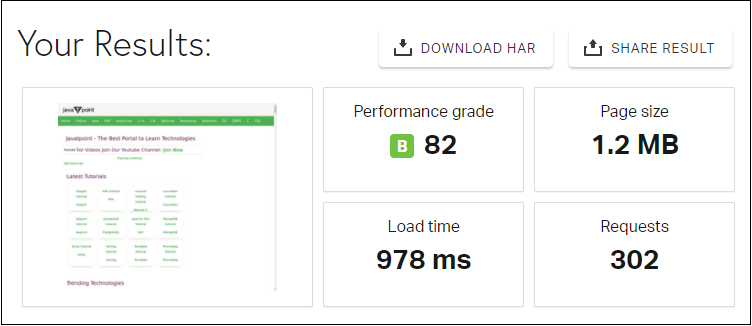
As you can see in the following image, each step of the page load process is color-coded: 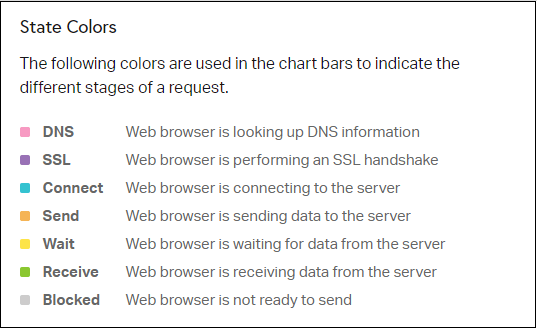
Pingdom Tool Test LocationsCurrently, Pingdom offers seven different test locations for its free speed test tool:
If your site targets a specific geographic area, you should choose the test location that's closest to that area. However, if your site targets visitors worldwide, you'll want to run tests from different locations. This will let you see how your site will load for visitors around the world. If you notice slow load times in certain areas, you may want to start using a content delivery network (CDN) to speed up your global page load times. How Pingdom Calculate Load Time?It is easy to get caught up in optimizing your website's speed score. The only thing that matters is your site's Load Time. Generally, you want to aim for less than two seconds if possible. However, it's important to understand that "Load Time" isn't always the same across different tools because there are different metrics. There are two main ways to consider a website as loaded:
How to Use Pingdom Advanced Performance Analysis ToolsIn addition to basic information on your site's load time, file size, and HTTP requests, Pingdom also includes some advanced analysis tools that go deeper into your site's performance. Whereas the metrics in the box at the top are a snapshot of how your site is doing, the analysis metrics below it help you to go in and improve your site's performance.
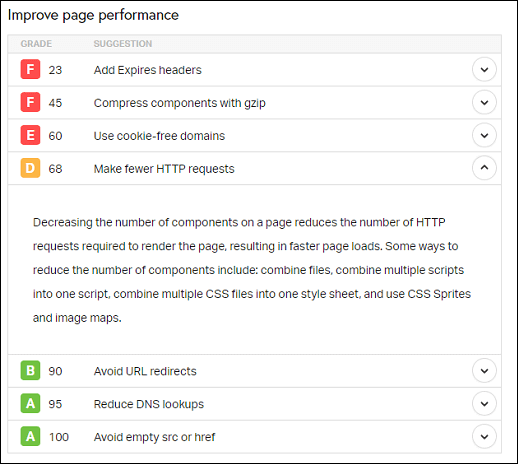
The next sections of the results show the primary areas of concern for the website. Some common features from earlier tests are highlighted here too. 1. Improve Page PerformanceThe Improve Page Performance section includes seven popular optimization tactics, as well as a score that indicates how well your site is already implementing each tactic, such as:
2. Response CodesThe response codes section tells you what's going on with all of the resources you're loading on the page and is especially useful if your website's been up and running for a while. Response codes in the 200s or 300s are usually fine, but you'll want to weed out all 400 and 500-class errors. 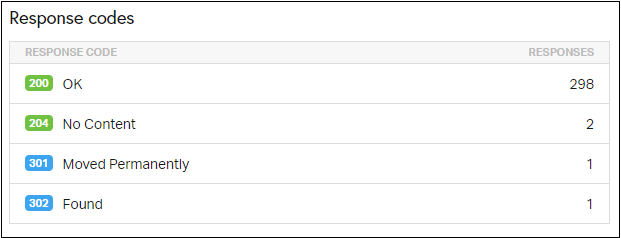
You can also use the waterfall (more on this in a moment) to figure out which resources are giving you 404 and 500 errors and take the appropriate steps to remove them or modify your site. 3. Content and Request BreakdownFour tables give you information about the distribution of your content and your requests. 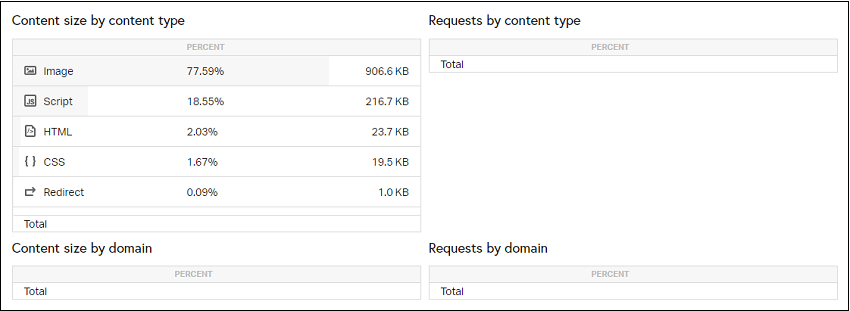
You want to load content mostly from local sources or from a CDN. If you load a lot of content from off-site sources, you may risk slowing down your site if it has to wait for the slow responses of others. 4. File Requests (Waterfall Analysis)The file requests section shows every single HTTP request on your site. For example, if you saw 50 HTTP requests in the summary box at the top, this section will have 50 entries, one for each HTTP request. Developers use this tool to gain a visual understanding of how a site loads and where the bottlenecks are. It shows a wealth of information, especially if you use the expander arrows to get to the details of each request. 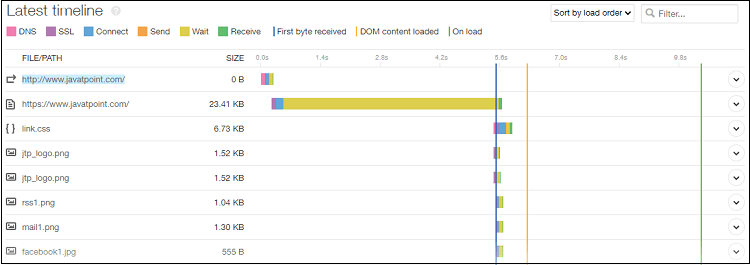
The icon on the right indicates the type of content being requested. If the response isn't of the 200 class, you'll see an alert icon. Finally, there's a horizontal bar graph that shows you when and how the resource loaded. For local resources, it's a good idea to keep an eye on the connect sizes. Lengthy connect times can indicate a problem with your host that assuming your site is otherwise well-configured. Search for long bars that hinder your website's loading or external resources with a lengthy DNS or another metric. Pingdom PricingPingdom offers a 14-day free trial and two paid services, each of which has scaling prices depending on your usage:
You can choose to use one or both of them, depending on your needs. Each service starts at $10 a month, and the price scales up from there based on the following metrics:
NOTE: The 14-day free trial includes access to both Synthetic Monitoring and Real User Monitoring.Paid Pingdom FeaturesWhen you purchase a pro account of Pingdom, then it provides the following powerful features. You can also test all of these features with a 14-day free trial.
Pingdom also has built-in integrations for certain apps, such as Slack, and you can also set up your integrations with Webhooks, such as using Zapier and Webhooks to connect to any app.
Next TopicWhat is ACMarket
|
 For Videos Join Our Youtube Channel: Join Now
Feedback
- Send your Feedback to [email protected]
Help Others, Please Share


