| |

Prometheus MonitoringPrometheus OverviewPrometheus is a toolkit, i.e., open-source systems alerting and monitoring the toolkit. Originally, it was built on SoundCloud. Many organizations and companies have approved this project. It contains an active user community and developer, since its initiation in 2012. Now, it is an open-source project and controlled independently of the companies. In 2016, after Kubernetes, Prometheus involved Cloud Native Computing Foundation as a second hosted project. It documents real-time metrics within the time series database. This project was written in Go. It was licensed upon Apache 2 License. Architecture of Prometheus Monitoring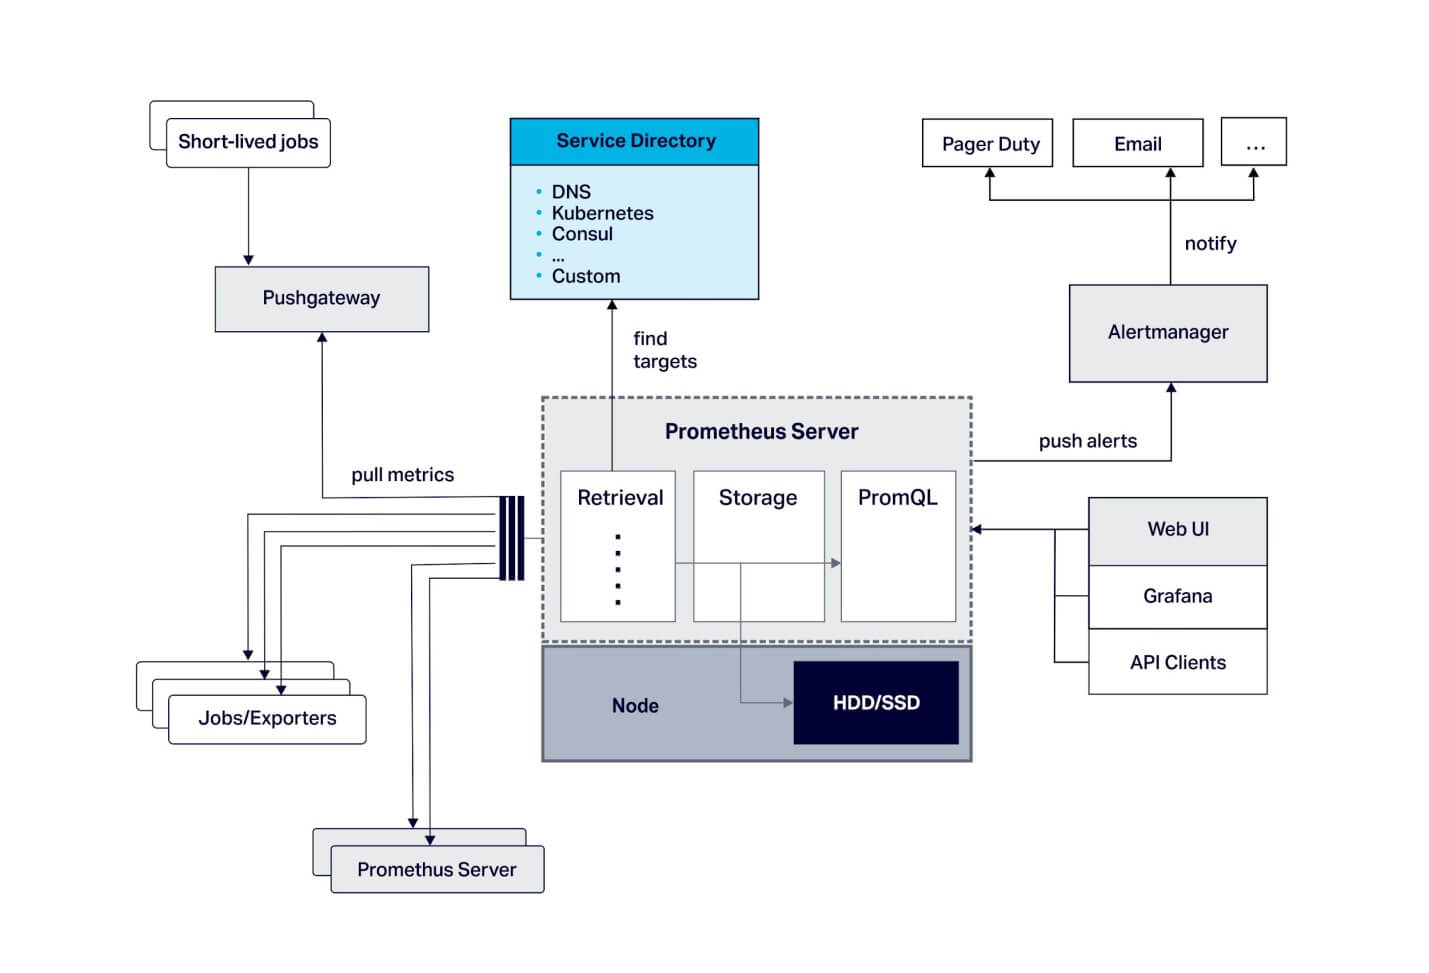
Working of PrometheusPrometheus can run in Go and Docker applications. The monitoring software can be defined as the time-series database along with the UI (User Interface) and flexible, sophisticated query language known as PromQL. Prometheus assembles metrics through instrumented jobs. The samples can be stored locally. Also, it can be scanned via rules to either record or collect any new time-series through existing data and make design alerts. These metrics are shown via way of histograms, gauges, and counters. Data can be transmitted via HTTP with plaintext. Features of PrometheusSome primary aspects of Prometheus are discussed as follows:
Prometheus UsesVarious departments of the IT field use Prometheus for trying to catch issues and intrusions within the Cloud environments. Also, it is utilized for presenting product information, application data, service, and site that is connected to many site visitors. Prometheus has been applied by organizations like DigitalOcean, Ericsson, CoreOs, Weaveworks, Red Hat, Google, Docker, and Boxever. Prometheus supports those executing cloud-managed sites, applications, and services for ensuring accurate functions for several customers. Prometheus is also very essential for customers, i.e., customer-facing. The software shows admissible data to many customers about trends, reviews, sales, and products. Components of PrometheusPrometheus components are mostly defined in a programming language, i.e., Go, and can be deployed and built as static binaries. Many of its components are optional. Its components are:
Fundamentally, Prometheus depends on pulling, or scraping, metrics through defined endpoints. It means that our application requires disclosing any endpoint where many metrics are present and advise the server of Prometheus to scrape it. There are various exporters for various applications that don't include a way for adding web endpoints, like Cassandra and Kafka. Fundamentally, Prometheus depends on pulling, or scraping, metrics through defined endpoints. It means that our application requires disclosing any endpoint where many metrics are present and advise the server of Prometheus to scrape it. There are various exporters for various applications that don't include a way for adding web endpoints, like Cassandra and Kafka. PromQLPrometheus facilitates its query language, i.e., Prometheus Query Language (PromQL). It enables users to aggregate and select data. Specifically, PromQL is adjusted for working in assemblage with the Time-Series database. Prometheus contains four types of metrics which are listed below:
Gauges and CountersThe two types of metrics are gauges and counters. These are the simplest types for understanding because it is easy to link it to any value. These types define how many resources of a system our application is currently using and also how many of the events are processed. A counter can be defined as any cumulative metric that illustrates an individual increasing counter monotonically whose value may only reset or increase to zero over a restart. Such as, we can apply a counter for representing the number of errors, tasks completed, and requests served. Because we can't decrease any counter, it should and can be used for representing cumulative metrics only. A gauge can be defined as any metric that illustrates an individual value that may go down and up arbitrarily. Gauges are used to measure the values typically or latest memory usage. Summaries and HistogramsPrometheus provides its support for two types of complex metrics: Summaries and histograms. These metrics are used to track the observation's number and observed value's sum. It makes time series within the database. Such as, they all make observed value's sum with the suffix, i.e., _sum. A histogram is used to sampling the counts and observations (things like response size or request durations usually) in the configuration buckets. Also, it facilitates the sum of each observed value. It enables a histogram an essential candidate for tracking things such as latency that may contain SLO (Service Level Objective) defines across it. A summary is used to sampling various observations (things such as response size or request durations usually). Also, it gives observation's total count and each observed value's sum. It can calculate configurable quantities on any sliding time window. An important difference among histograms and summaries is that histograms disclose counts of bucketed observation and the quantities calculation through the histogram's buckets happens over the server-side with a function, i.e., histogram_quantile(). Some other key points are as follows:
Next TopicBest Video Downloader for Chrome
|
 For Videos Join Our Youtube Channel: Join Now
Feedback
- Send your Feedback to [email protected]
Help Others, Please Share


