| |

What is t-Test?A t-test is a type of inferential statistic used to determine the significant difference between the means of two groups, which may be related to certain features. A t-test is used as a hypothesis testing tool, which allows testing an assumption applicable to a population. A t-test looks at the t-statistic, the t-distribution values, and the degrees of freedom to determine the statistical significance. A t-test allows us to compare the two data sets' average values and determine if they came from the same population. For example, if we take a sample of students from class A and another sample of students from class B, we don't get the same mean and standard deviation. Similarly, samples taken from the placebo-fed control group and those taken from the drug prescribed group should have a slightly different mean and standard deviation. Mathematically, the t-test takes a sample from each of the two sets and establishes the problem statement by assuming a null hypothesis that the two means are equal. Based on the applicable formulas, certain values are calculated and compared against the standard values, and the assumed null hypothesis is accepted or rejected. If the null hypothesis qualifies for rejection, it indicates that data readings are strong and not due to chance. The t-test is just one of many tests used for this purpose. Statisticians must additionally use tests other than the t-test to examine more variables and tests with larger sample sizes. Statisticians use a z-test for a large sample size. Other testing options include the chi-square test and the f-test. T-Test Assumptions
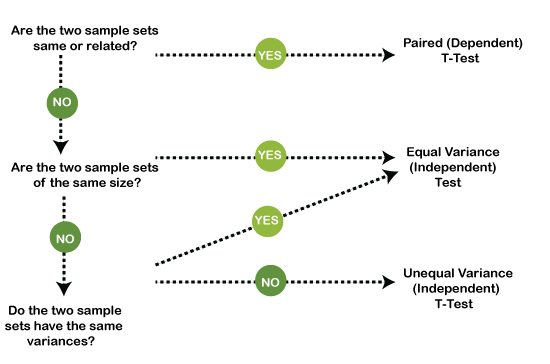
When to Use a T-Test?A t-test is only used when comparing the means of two groups' also known as a pairwise comparison. If you want to compare more than two groups or make multiple pairwise comparisons, use an ANOVA test or a post-hoc test. The t-test is a parametric test of difference, which means it makes the same assumptions about your data as other parametric tests.
If your data do not fit these assumptions, you can try a non-parametric alternative of the t-test, such as the Wilcoxon Signed-Rank test for data with unequal variances. Types of T-TestsThere are three types of t-tests we can perform based on the data, such as: 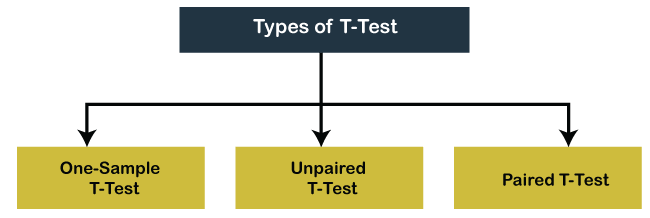
1. One-Sample t-test In a one-sample t-test, we compare the average of one group against the set average. This set average can be any theoretical value, or it can be the population mean. In a nutshell, here's the formula to calculate or perform a one-sample t-test: 
Where,
Note: As mentioned earlier in the assumptions, a large sample size should be taken for the data to approach a normal distribution. Although t-test is essential for small samples as their distributions are non-normal.2. Unpaired or Independent t-test The unpaired t-test is used to compare the means of two different groups of samples. For example, we want to compare the male employees' average height to their average height. Of course, the number of males and females should be equal for this comparison. This is where an unpaired or independent t-test is used. Here's the formula to calculate the t-statistic for a two-sample t-test: 
Where,

Here, the degree of freedom is nA + nB - 2. We will follow the same logic we saw in a one-sample t-test to check if one group's average is significantly different from another group. That's right - we will compare the calculated t-statistic with the t-critical value. 3. Paired t-test The paired sample t-test is quite intriguing. Here, we measure one group at two different times. We compare different means for a group at two different times or under two different conditions. A certain manager realized that the productivity level of his employees was trending significantly downwards. This manager decided to conduct a training program for all his employees to increase their productivity levels. The formula to calculate the t-statistic for a paired t-test is: 
Where,
Calculating T-TestsCalculating a t-test requires three key data values. They include the difference between the mean values from each data set called the mean difference, the standard deviation of each group, and the number of data values of each group. The outcome of the t-test produces the t-value. This calculated t-value is then compared against a value obtained from a critical value table called the T-Distribution Table. This comparison helps determine the effect of chance alone on the difference and whether it is outside that chance range. The t-test questions whether the difference between the groups represents a true difference in the study or possibly a meaningless random difference.
Next TopicWhat is Ecosystem
|
 For Videos Join Our Youtube Channel: Join Now
Feedback
- Send your Feedback to [email protected]
Help Others, Please Share


