| |

Server Monitoring ToolsIntroductionEnterprises operates more than one server for delivering business demanding services for the end-users. A few of them include web servers, caching servers, core app servers, database servers, and others. Performance of all of the servers is in demand. It is because when a single server fails, it affects the business services delivery. So, it is necessary to know proactively about the issues of performance, therefore, they are recognized at an early level and established before they pose any threat to the business. The tools of server monitoring support are used to monitor various servers and the whole infrastructure. It also facilitates comprehensive reports on ability planning for maintaining the network without difficulties. What is a Server Monitor?The monitoring process of a server is to monitor the system resources of a server such as a Process, Disk Usage, I/O Network, Memory Consumption, CPU Usage, etc. Also, server monitoring supports capacity planning through understanding the system resource usage of a server. A software of server monitoring supports to automate the server monitoring process. The performance of monitoring server supports to identify other related issues of the performance such as response time, app downtime, and resource utilization.
Server Monitoring SoftwareThe tools for server monitoring support users to identify and resolve any application performance and hosting issues by monitoring and tracking server performance. In Real-Time, Server Metrics MonitoringMonitoring the metrics performance of the server such as disk utilization and CPU utilization are demanding factors to keep the focus on to deduce the load on our CPU and determine the overall memory utilization of the server. We can understand the load amount on any server by tracking some of the parameters like packet numbers transfer/received in a network interface.
Performance Monitor Dashboard in Real-Time-ServerA trusted tool for server monitoring, i.e., OpManager monitors several performance metrics like Disk utilization/Memory/CPU. In real-time, it facilitates the graphical perspective of the metrics for monitoring and measuring server performance. It also permits us to drill down to any specific time interval for understanding more regarding the problems and proactively take essential actions. By utilizing it, we can fix-up the issues to prevent serious harm to our business. The tools of network monitoring are used to monitor the performance and availability of other networking mechanisms such as printers, storage devices, routers, switches, and more. Also, we can instantly obtain an integrated view of our server status by setting up a custom server monitoring dashboard like server performance monitoring dashboard, Linux server monitoring dashboard, Windows server monitoring dashboard, etc. Monitoring Server Health and AvailabilityOne of the dominant server tools for performance monitoring is OpManager. It offers several out-of-the-box aspects like server availability monitoring and 300+ performance metrics like disk I/O, free physical memory, processor queue length, page read/write, process queue length by WMI, and SNMP protocols. A feature of OpManager, i.e., server uptime monitoring supports us to keep all tabs available of every virtual and physical server 24*7. We can monitor possible performance metrics all time and find performance issues at the early levels by using robust features such as server monitoring dashboards. Also, we can build our custom monitor with the help of a template of server monitoring dashboards apart from any default monitor. Each collected information of any server performance metrics is resided in a database for proper investigation and for creating yearly and monthly performance reports. There are some of the most important tools for server monitoring are as follows: 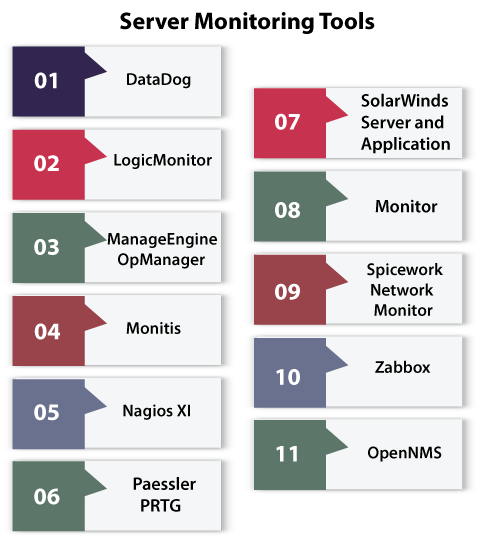
Let's discuss the above tools in detail. DatadogDatadog tool is a service of American monitoring for various cloud-scale applications. It facilitates server monitoring, services, tools, and databases by a SaaS-based data analytics environment. The monitoring tools of Datadog can consolidate with various cloud servers and environments including SQL server, Kubernetes metrics server, and Microsoft Exchange server. LogicMonitorIt is a SaaS-based performance monitoring environment that provides integrated server monitoring. Automatically, the solution discovers every network interface and device with 1500+ integrations of database technologies, storage, server, cloud deployments, network hardware. The server monitoring solution of LogicMonitor provides memory and CPU alerting, data request per second visualization, volume utilization, and support for Linux servers, Windows, AIX, IBM, and Microsoft Exchange. ManageEngine OpManagerIt is software for network monitoring. It also provides various capabilities for server monitoring. OpManager executes real-time network monitoring, WAN links, and virtual and physical servers. It discovers and evaluates the performance of all devices linked to the network. Periodically, the solution monitors virtual and physical servers via WMI and SNMP protocols, performance in real-time, availability, and monitoring server health. MonitisMonitis can be defined as a solution for performance monitoring. It evaluates the performance of applications, servers, websites, and networks for Linux and Windows deployments. Their solution of server monitoring includes disk, storage, memory, and CPU monitoring to server health inspections additionally. In expansion to monitoring websites and networks, monitis provides several capabilities for custom service monitoring to support IT teams to accommodate their monitoring outcomes to meet their requirements. Nagios XIIt is a centralized enterprise network, application, and server monitoring software. Users obtain insight into network protocols, services, applications, server performance. Nagios XI software supports tons of third-party add-ons to permit the software for monitoring basic business applications. The environment contains a customizable graphical user interface so users could develop the best design and layout for the needs of their IT team. Paessler PRTGIt is used for IT monitoring that includes network, server, bandwidth, IP, cloud, and application monitoring. This software works as the all-in-one monitoring collection which also can monitor the hardware, virtual machines, and cloud environments in expansion to the network. PRTG can analyze a wide range of server types such as storage, database, mail, and web. The tool merges server management and monitoring it into an individual solution. SolarWinds Server and Application MonitorIt is a solution that is used for application and server monitoring that permits IT teams to analyze the performance and status of servers. This tool monitors the critical hardware components of our server including battery usage, CPU usage, power supply, device temperature, and fan speed. SolarWinds also supports customizable monitoring of servers. It allows the departments of IT to work with import custom scripts or pre-established that Implement with the deployments. Spiceworks Network MonitorIt is a free server and network monitoring program. It is one of the various network tools that the Spiceworks Network Monitor offers. Its monitoring solution provides real-time monitoring abilities for Linux servers, Windows servers, and networks. We can execute ping checks for verifying that our server and each connected nodes are functional currently. The tool permits begin and finish of malfunctioning server processes and services through the software instead of at the impacted server. ZabbixIt is the open-source monitoring tool collection that includes various functions for server monitoring such as server health and server performance monitoring. Zabbix measures memory and CPU, server and network bandwidth usage, and interface error and packet loss rate. The solution analyzes availability parameters such as hardware, system status checks, remote server monitoring, and disk space availability. OpenNMSIt is a complete open-source server monitoring tool published under the AGPLv3 license. OpenNMS is created for scalability. It can monitor tons of devices through an individual instance.
Next TopicWebmaster Tools
|
 For Videos Join Our Youtube Channel: Join Now
Feedback
- Send your Feedback to [email protected]
Help Others, Please Share


