Excel Student Table
Effectively maintaining student data is essential to promoting a well-organized and effective workflow in the dynamic fields of education and administration. It turns out that Microsoft Excel is a very flexible and user-friendly program that provides a complete answer for making an intricate student table. This introduction starts with creating a Microsoft Excel student table by highlighting the importance, advantages, and basic procedures involved.
The Significance of an Excel Student Table
Educators, administrators, and educational institutions deal with enormous amounts of student data daily. An Excel student table with proper structure offers a centralized platform for quickly organizing, analysing, and retrieving this data. A Microsoft Excel student table is a strong repository, improving data management effectiveness. It contains everything from fundamental information such as names and IDs to complex measures like academic success and contact details.
How to Create a Student Database in Excel?
The need for a large volume of data makes building a student database crucial. Databases with consistency can handle large volumes of information and data. Thus, a database will be created to assess student performance, and a database will begin building the Excel student database.
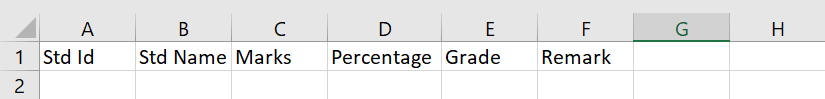
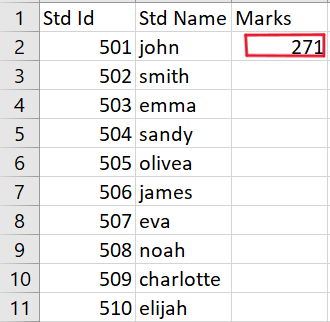
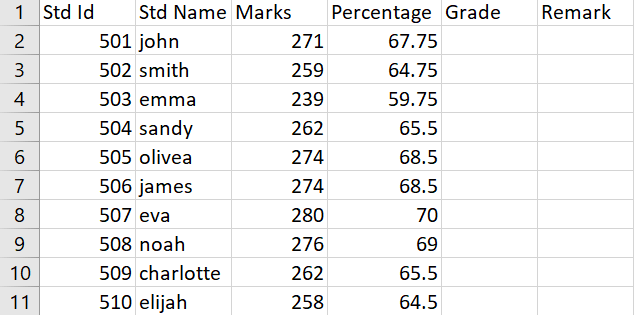
Step 1: Enter Data for Student
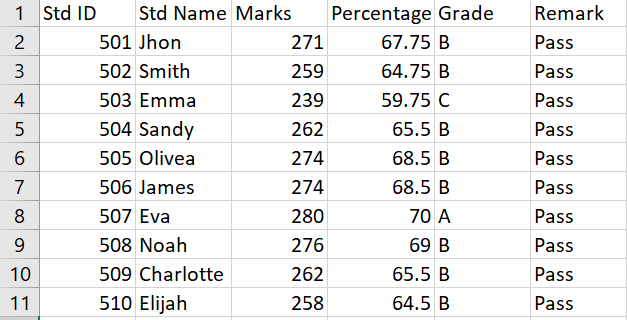
- The database's column names are in the field. We have unlimited access to enter fields into the database.
- Our database includes the following: total acquired marks, percentage of these marks, grade, comment, student ID as standard ID, and student name as standard name. This database contains those fields.
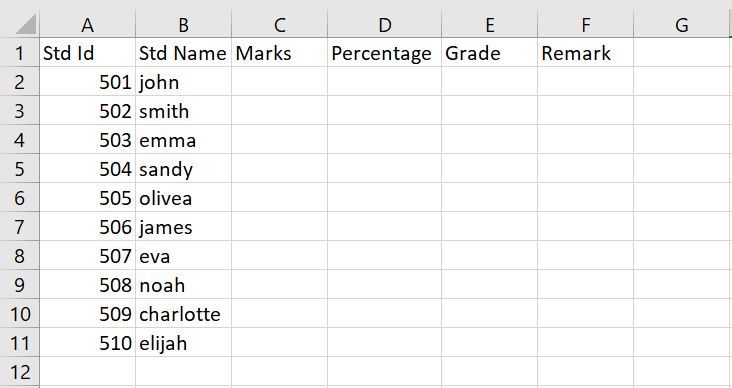
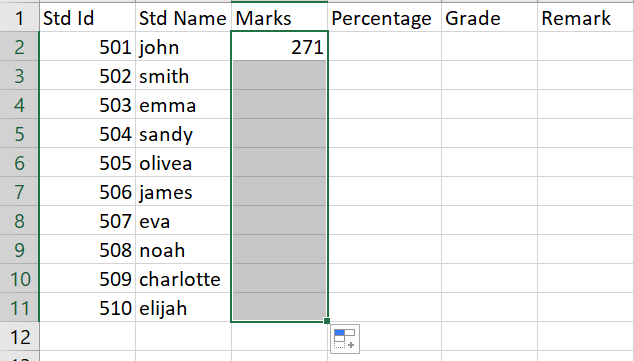
Step 2: Launch Student Data Correctly
- We now have to accurately enter each student's information.
- We can now rapidly enter data into the database after filling out the students' data fields.
- Every new instance in the Fields will be added to the first vacant lot.
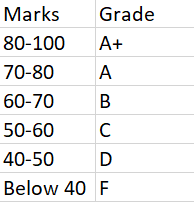
Step 3: Make Grade Distribution Description
- Here, we'll adhere to the regular grade allocation for the school.
- To make it easier to understand, we maintain the grade for every mark number in a separate column and the mark number in the first.
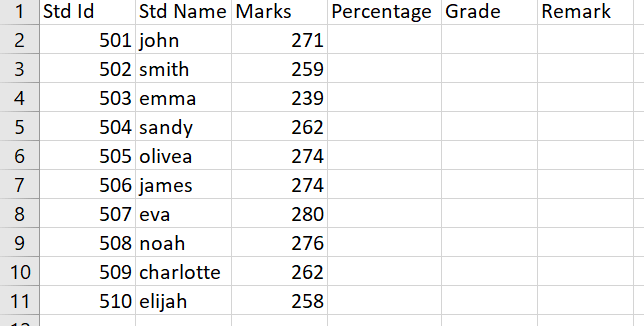
Step 4: Excel SUM Function to Aggregate Total Marks for Each Student
The database functions use the IF function to have criteria parameters that allow us to calculate only a portion of the data stored in the database and execute fundamental calculations, including SUM, AVERAGE, MAX, MIN, etc.
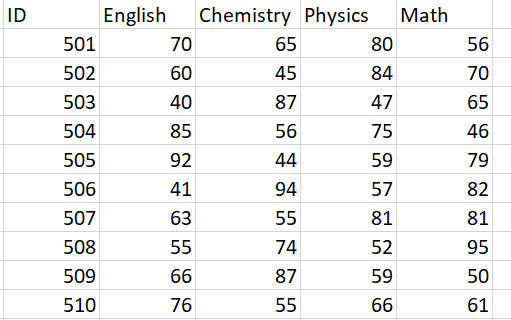
- First, we must ascertain each student's grades in each topic to get their total score.
- Simply said, we create a new dataset for this purpose that contains the student ID and their English, Chemistry, Physics, and Math grades out of 100.
- Finding each student's total score is now necessary. We are utilizing the SUM function for this.
- Also, choose the cell where you wish to enter the formula combining the SUM function. Thus, we choose cell D5.
- Next, enter the formula in the chosen cell.
- In addition, hit Enter to view the outcome.
- To replicate the formula across the range, drag the Filling Handle down. Alternatively, double-click the Plus (+) symbol to AutoFill the range.
- Lastly, column D displays each student's overall grade.
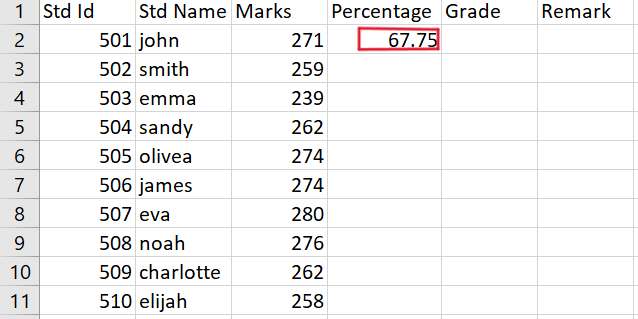
Step 5: Find out Percentage
We must enter all the exam marks to determine the proportion of marks every student receives. We are aware that the combined scores for English, Chemistry, Physics, and Maths are 100 out of 100, or 400 points.
- We will first insert this inside cell I14 since we need it to build our formula. Additionally, this cell will use the formula as the only cell reference.
- In a similar manner to the preceding step, choose cell E5 and replace the formula.
- Next, hit Enter. The formula bar will display the formula.
- Moreover, pull the Fill Handling downward to repeat the formula over the range. Double-clicking upon the Plus (+) mark will cause the range to AutoFill.
- We shall determine each student's percentage of marks at the conclusion.
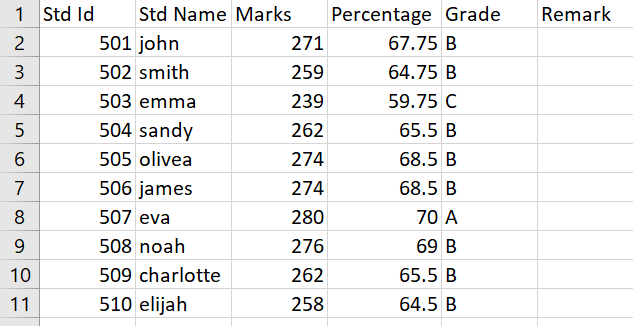
Step 6: Discover the Grade of Each Student
We now need to locate each student's grades. We will create a simple criterion to determine the grade and use the IF function to do this.
- First, select the cell where you wish to enter the grade calculation algorithm.
- Next, type the following formula into that field.
- Click the Enter key to finish the process after that.
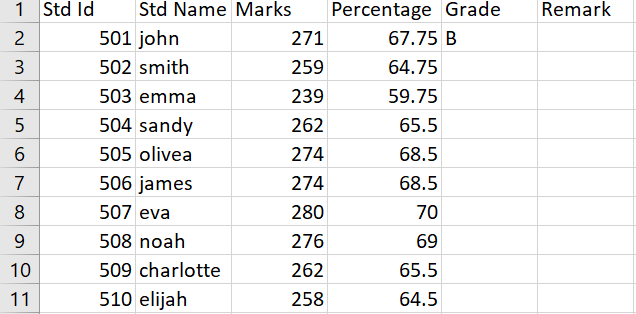
- Moreover, double-click the Plus (+) button or drag the Fill Handling down to duplicate the formula across the range.
- Finally, we will enter every student's grade into the database.
Step 7: Obtain Remark
We will now acquire a column to provide commentary on their outcome. The student was given a passing or failing grade.
- As in the previous procedures, pick cell G5 first.
- Next, enter the following formula in the cell that you have chosen.
- Press Enter to view the outcome.
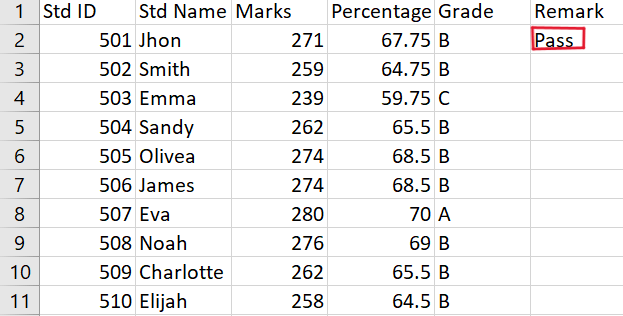
- Pull the Fill Handle lower now to carry out the formula over the range. To auto-fill the range, double-click the Plus (+) symbol.
- We will be able to view each student's comments at the conclusion.
Step 8: Create Table
Including a table has several benefits, the main one being the ability to graphically classify information. Because Excel tables are adaptable by default, you can add and remove rows and columns without worrying about them growing or shrinking. Tables make reading the issues displayed in the columns and rows simple and quick. The last step is to create the database table.
- First, choose all available data.
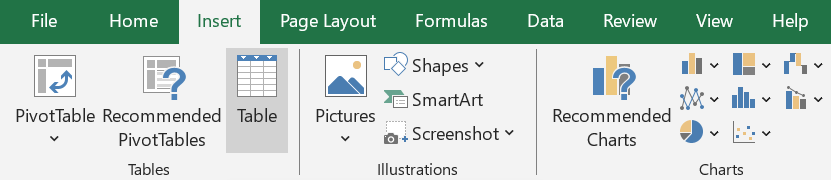
- Navigate through the ribbon to the Insert tab.
- Next, select Table from the Tables category.
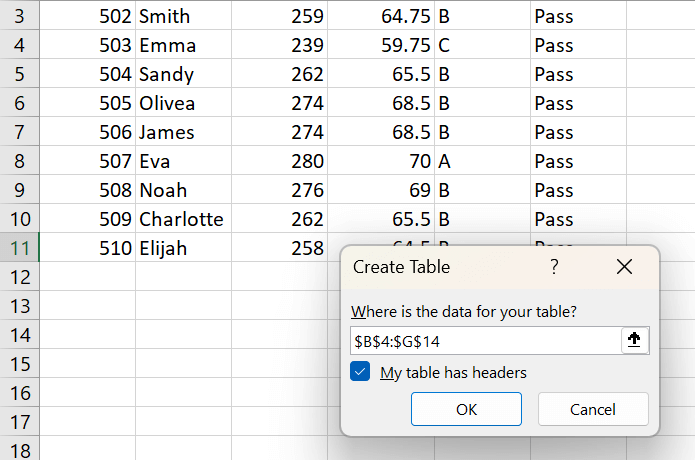
- The Create Table dialogue box will open as a result.
- Mark the box that says, "My table has headers."
- Moreover, press the OK button to finish the procedure.
- Your database will then have a table.
- The Table is now easily modifiable.
Why do we Use Excel to Create Databases?
We call our data, which is organised into rows and columns in Microsoft Excel, records. We record our data in Microsoft Excel, and this is a database since it is a commonly used tool. Possessing the data in Microsoft Excel can make your life easier because it's a powerful tool that lets us work with data. Spreadsheet software such as Excel is used for calculating and testing data and may store enormous amounts of data in spreadsheets with one or more sheets.
- Familiarity and Accessibility:
Excel is a popular tool that many users, including small organisations and individuals, are familiar with. Excel is suitable for individuals who are not database professionals since people frequently use their existing program knowledge to manage and organise data.
- User-Friendly Interface:
Excel provides a clear interface with rows and columns, mimicking a grid. Users can simply input and arrange data without requiring specialist skills in database management.
- Quick Data Entry:
Excel's simplicity makes data entry quick. Users may easily access and edit information using basic keyboard shortcuts, and they can enter data straight into cells. It is, therefore, a sensible option for jobs requiring speedy data collection.
- Basic Data Analysis:
Excel has built-in capabilities for simple computations utilising formulas, functions, and tools for sorting and filtering. Users can create straightforward charts and graphs for basic data analysis without further software or statistical analysis expertise.
- Versatility:
Excel can handle various data kinds, such as formulas, dates, numbers, and text. This flexibility enables users to manage several kinds of information in one spreadsheet, making it suitable for various data management requirements.
- Small-Scale Databases:
Excel can handle small-scale databases and projects with comparatively low data volumes. Excel might be a workable alternative for individuals, small organisations, or projects with low data requirements.
- Integration with other Office Tools:
Since Excel is a Microsoft Office suite component, it can easily integrate with Word, PowerPoint and other programs. Workflow efficiency is increased by users' ease of data copying and pasting between programs.
Benefits of Utilizing Excel for Student Table:
With so many advantages, handling student data with Microsoft Excel is a popular option among teachers, administrators, and institutions. Here are a few main benefits:
- Efficieny in Data Entry: Excel offers an organised grid structure that makes data entry fast and easy. By using a tabular arrangement, users may effortlessly enter and update student information, reducing the possibility of errors that arise from manual record-keeping.
- Customization and Flexibility: Users of Excel can adjust rows, columns, and formatting to meet individual needs. Because of its adaptability, the student table may hold a variety of data, from fundamental demographics to more in-depth information about extracurricular and academic activities.
- Powerful Data Analysis: Excel comes with a wide range of built-in capabilities and operations that let users do effective data analysis. Users can compute totals, percentages, averages, and more, which offers insightful data on trends and student performance.
- Sorting and Filtering Capabilities: Excel's sorting and filtering features enable users to arrange data in a number of ways, alphabetically, or according to predetermined standards. Finding patterns or trends in a student's dataset is made easier with the help of this feature.
Conclusion:
In conclusion, Excel offers a useful and approachable way to handle student data, especially for small colleges and universities or individual teachers. The spreadsheet format makes basic analysis, data entry, and modification simple. Excel's ease of use makes it a good tool for organising vital student data, such as contact details, identifying information, and metrics related to academic performance.
|

 For Videos Join Our Youtube Channel: Join Now


