| |

HOW TO CALCULATE DESCRIPTIVE STATISTICS IN EXCELIntroduction:Descriptive Statistics in Excel sums up the factual information involving the accessible data in the dataset. This strategy additionally furnishes us with different kinds of result choices. The Excel Graphic Measurements capability is an inbuilt apparatus viewed as in the "Data Analysis" gathering of the "Data" tab. Descriptive Statistic rapidly sums up your information and gives you a couple of information focuses that you can use to rapidly understand the whole informational collection. While you can likewise work out every one of these factual qualities separately, involving the engaging measurements choice in Excel rapidly gives you this information in one single spot (and it's much quicker than utilizing various equations to ascertain various qualities). In this short instructional exercise, I will tell you the best way to get Graphic Measurements in excel. This Tutorial Covers:
Key points:
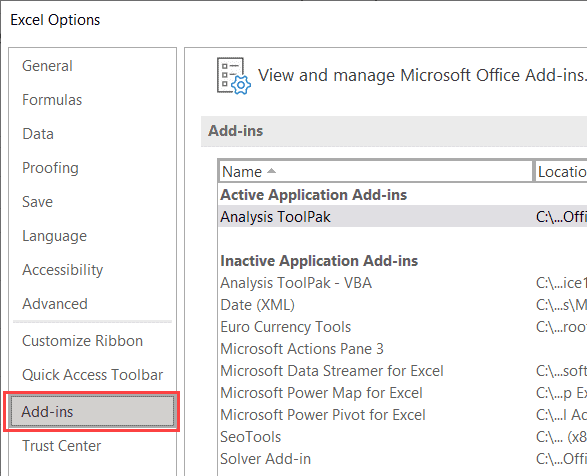
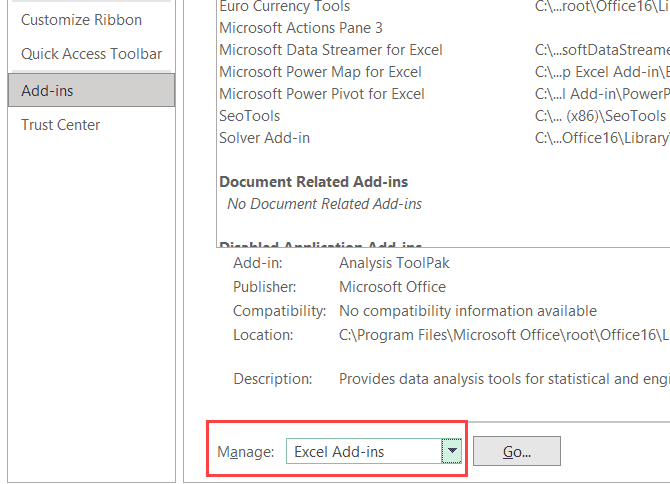
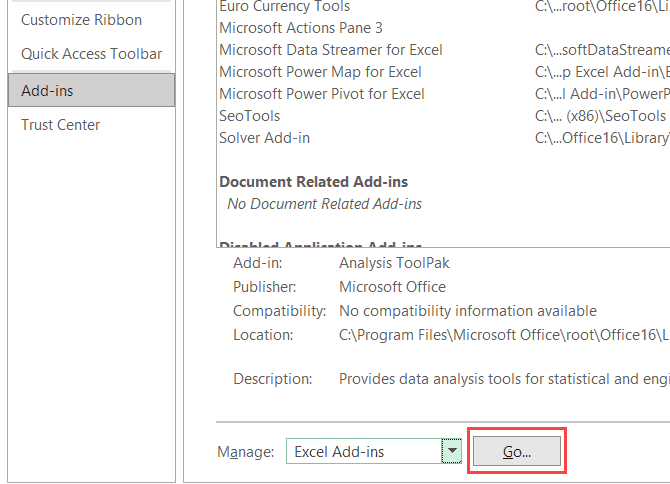
Descriptive Statistics in Excel:To get the Descriptive Statistics in Excel, you really want to have the Information Examination Toolbar empowered. You can check whether you as of now have it empowered by going to the data. Assuming you see the Information Examination Choice in the Examination bunch, you as of now have it empowered (and you can skirt the following segment and go straightforwardly to the 'Getting Illustrative Examination's part). On the off chance that you don't see the data analysis option in the data tab follow the means in the following area to empower it. Enabling Data Analysis ToolbarThe following are the moves toward empower the Information Examination Toolbar in Excel:
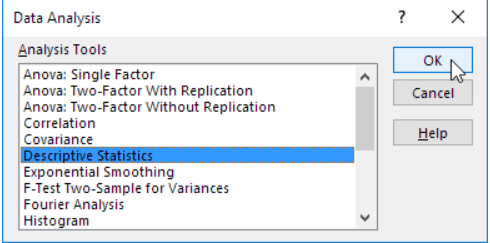
Getting the Descriptive Analysis:Now that the Information Examination Toolbar is empowered, how about we perceive how to get the expressive insights utilizing it. Assume you have an informational index as displayed beneath where I have the business information of various results of an organization. For this information, I need to get elucidating measurements. The following are the moves toward do this:
Note: in the above example we have just involved Section B as the information source (as you can involve numeric information as the contribution here)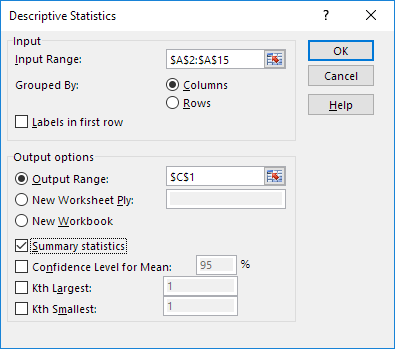
Note: You can decide the going with in a state of harmony 8
Conclusion:With everything taken into account, Microsoft Excel offers a thorough set-up of capacities for working out unquestionable estimations, engaging clients to look at data effectively. By utilizing worked in gadgets like mean, median, MODE, and others, Excel works with the examination of data central affinities, variability, and flow. Through these calculations, clients gain critical pieces of information into their datasets, supporting powerful cycles across various regions. Excel's straightforward connection point areas of strength for and limits make it a fundamental gadget for specialists and experts the equivalent, drawing in them to eliminate critical information and get significant pieces of information from their data easily and capability. |

 For Videos Join Our Youtube Channel: Join Now
Feedback
- Send your Feedback to [email protected]
Help Others, Please Share


