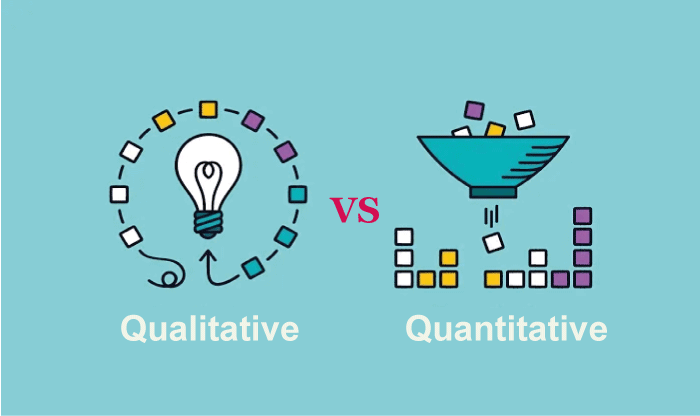
Difference Between Qualitative And Quantitative DataIt has always been the case that Qualitative and quantitative data are mostly used in research, analysis, and decision-making from ancient to modern times, just that their practical ways differ. These two types of data are distinct and serve different purposes. Still, they can be used together to completely understand a phenomenon or situation, which is a common ground for their categorization. 
The concept of qualitative and quantitative data initially arose in the field of statistics, which is the study of collecting, analyzing, and interpreting data for various purposes. In the 18th century, German philosopher Immanuel Kant was the first to distinguish between qualitative and quantitative data. He asserted that there are two types of knowledge: Analytical Knowledge and Empirical Knowledge. The contrast between empirical and logical knowledge served as the basis for the distinction between qualitative and quantitative data, which is still often employed today. 
Differentiation of the DataDifferentiating data is a crucial component that has been of research and experimentation. When gathering data, we frequently encounter circumstances where finding patterns and trends becomes necessary to make meaningful judgments later in the planning process. Differentiating data becomes important in this situation. Data differentiation allows us to spot patterns and trends that might not be readily apparent in the raw data to be more organized. To better comprehend the data, we maybe need to categorize it into different groups and examine each group independently. As a result, our judgments and decisions are more reliable as they are more based on simplification and consistent working. Conducting experiments also benefits in differentiating the data. It might be difficult to pinpoint which of an experiment's many factors is responsible for the impact being seen. We can separate the effects of each variable and identify which variable is producing the impact by differentiating the data. Using several data sets significantly reduces experiment error. We may fix any mistakes or contradictions by thoroughly examining the data before making judgments. This aids in guaranteeing the precision and dependability of the outcomes. Data that is quantitative and qualitative have different properties and uses. Statistical approaches may measure and evaluate quantitative data, but qualitative data is non-numerical and offers insights into attitudes, views, and behaviors. The following are a few examples of how to use both quantitative and qualitative data in real-world circumstances: Uses of Quantitative Data in the Real World
Uses of Qualitative Data in the Real World
History of Study of Data TypesThe history of the development of numbers is an intriguing subject that goes back to the earliest civilizations. Humans invented numbers to measure, count, and keep track of objects. In 4000 BC, the Sumerian culture in Mesopotamia left the oldest traces of numeral systems. They employed a sexagesimal (base 60) method to calculate time and distance. The Egyptians also created a numerical system in 3000 BC, using hieroglyphics to represent numerals. They employed a decimal (base 10) method to count and measure things. The development of numbers allowed humans to record transactions, keep track of time, and create complex mathematical ideas, significantly influencing human civilization. The works of Euclid, Pythagoras, and Archimedes built the foundation for contemporary mathematics, and the ancient Greeks were the first to develop a systematic system of mathematics. Over the Middle Ages, the Arabic numeral system replaced Roman numerals, and fundamental mathematics was further considered in the realm of scholars. The Arabic numbers were simpler to use and understand, making it easier for individuals to do difficult mathematical computations. From science and engineering to economics and commerce, almost in every domain, numbers are employed in nearly every facet of modern life. They quantify and measure everything, including time, distance, and weight. The discovery of numbers, which provide us the ability to measure, count, and keep track of our surroundings, has significantly contributed to the development of human civilization. The development of numbers has made it easier to safeguard data, preserve it, and understand time. Since researchers and academics have sought to better and find new ways to boost the effectiveness of data-related tasks, the study of data kinds, particularly quantitative and qualitative data, has a long and rich history that spans many centuries. These two sorts of data have been around since the beginning of science and the establishment of the scientific method. As scientists started using mathematical techniques to investigate the natural world regarding land size and borders with places during the scientific revolution of the 16th and 17th centuries, quantitative data emerged. Modern mathematics and statistics were developed then, allowing scientists to measure and analyze data more precisely and organized manner. Galileo utilized a pendulum to gauge the rate of acceleration brought on by gravity in his experiments on falling objects, among the earliest instances of quantitative data processing. On the other hand, with the emergence of anthropology and sociology as academic disciplines, which were also increasing research fields, qualitative data developed as an accessible sort of data in the early 20th century. Social scientists started looking more closely at social systems and human behavior to connect with the structural or behavioral side. They created techniques for compiling and interpreting qualitative data, including focus groups that may serve as test subjects, data source interviews, and ethnographic observation. Anthropologists like Franz Boas and Margaret Mead, as well as sociologists like Max Weber and George Herbert Mead, were early proponents of qualitative research. Midway through the 20th century, business, psychology, and education all started to emphasize the study of data kinds. When educators started using quantitative techniques to assess student performance and spot growth areas, psychologists created standardized tests to analyze cognitive and emotional characteristics. Quantitative data analysis is now crucial for market analysis and decision-making in business. With the advent of new technologies like computers and the internet in the second half of the 20th century, the study of data kinds continued to advance. Big data and data analytics have become increasingly popular due to these innovations, allowing academics and practitioners to acquire and analyze massive volumes of data in real-time. As a result, disciplines like computer science, statistics, and information science have contributed to the multidisciplinary nature of the study of data kinds. Several academic areas nowadays need the analysis of different data kinds, and this field is continuously developing as new tools and techniques are created. Making informed judgments and resolving complicated problems require quantitative and qualitative data, crucial for understanding the natural world and human behavior. Qualitative DataData that is not numerical and is often gathered through observation, interviews, or surveys is called qualitative data. Qualitative data may be used to study complicated social, cultural, and psychological elements that may be hard to quantify and can give rich, nuanced information about a phenomenon or event. Qualitative data is frequently employed in anthropology, sociology, psychology, and education. Some Examples of Qualitative Data Include
Many techniques, including content analysis, theme analysis, and discourse analysis, are frequently used to study qualitative data. These approaches entail spotting patterns, themes, and categories in the data to derive conclusions about the phenomena or circumstances being examined. AdvantagesThe flexibility and adaptability of qualitative data are one of its main features. The needs and circumstances of the research topic may be catered to using qualitative research methodologies. Throughout the research process, they can be modified in real-time to account for fresh insights and changes. This allows for an in-depth exploration of the experiences and viewpoints of study participants and the exploration of subjects and problems that may not have been foreseen at the commencement of the study. Moreover, qualitative research permits the combination and adjustment of various data-gathering techniques, such as interviews, focus groups, observations, and document analysis, to meet the objectives of the research topic. Overall, qualitative data are useful for academics looking to develop a deep understanding of complex social phenomena because of their flexibility and adaptability. Quantitative DataQuantitative data is a type of data that is collected and analyzed using statistical and mathematical methods. It is characterized by its use of numerical values to measure and quantify variables, and it is commonly used in scientific research, market analysis, and business decision-making. Quantitative data can be collected through various methods, such as surveys, experiments, and observations, and it is often analyzed using statistical software to identify patterns, trends, and relationships. Some Examples of Quantitative Data
Income is a quantitative value that can be measured and used for statistical analysis.
These are just a few examples of quantitative data, and many other numerical data types can be measured and analyzed. AdvantagesThe capacity of quantitative data to give exact and accurate measurements of variables is one of its main features. This is so because numerical values-the foundation of quantitative data-can be measured and examined using statistical methods and mathematical procedures. This enables comparisons and the drawing of inferences from the data, which may be helpful in various scenarios. Quantitative data, for instance, may be used in market research to gauge consumer happiness, brand recognition, and purchase patterns, enabling firms to base their choices on the data. Quantitative data also has the benefit of being simple to duplicate and verify. Quantitative data may be collected and evaluated using established methods and processes since it is based on numerical values. This allows other researchers to reproduce the analysis and confirm the results. This is significant in scientific research since the validity and dependability of the results depend on the capacity to reproduce experiments. For instance, if a study reveals that a specific medicine successfully treats a specific ailment, other researchers can do a similar study to confirm the findings. Discrete and Continuous Data are two more categories that can be used for quantitative data.
Statistical techniques may be used to examine any data type, but the approach will depend on the data's characteristics. Statistics are frequently used to examine quantitative data since it can be measured or counted. Steps Involved In Processing DataThese are some data-related activities:
Difference Table
ConclusionThere are significant consequences for research and decision-making due to the basic discrepancies between quantitative and qualitative data. Comparatively speaking, qualitative data is exploratory and descriptive, whereas quantitative data is objective, quantifiable, and requires statistical analysis. Researchers and practitioners must select the best form of data based on their study questions and objectives since both data types have benefits and disadvantages. In various sectors and disciplines, performing efficient research and making well-informed judgments are crucial to understanding the distinctions between quantitative and qualitative data.
Next TopicDifference Between
|
 For Videos Join Our Youtube Channel: Join Now
Feedback
- Send your Feedback to [email protected]
Help Others, Please Share


