numpy.random() in PythonThe random is a module present in the NumPy library. This module contains the functions which are used for generating random numbers. This module contains some simple random data generation methods, some permutation and distribution functions, and random generator functions. All the functions in a random module are as follows: Simple random dataThere are the following functions of simple random data: 1) p.random.rand(d0, d1, ..., dn) This function of random module is used to generate random numbers or values in a given shape. Example: Output:
array([[0.74710182, 0.13306399],
           [0.01463718, 0.47618842],
           [0.98980426, 0.48390004],
           [0.58661785, 0.62895758],
           [0.38432729, 0.90384119]])
2) np.random.randn(d0, d1, ..., dn) This function of random module return a sample from the "standard normal" distribution. Example: Output:
array([[ 1.43327469, -0.02019121],
       [ 1.54626422,  1.05831067]])
b=np.random.randn()
b
-0.3080190768904835
3) np.random.randint(low[, high, size, dtype]) This function of random module is used to generate random integers from inclusive(low) to exclusive(high). Example: Output: array([1, 1, 1, 2, 0, 0, 0, 0, 0, 0]) 4) np.random.random_integers(low[, high, size]) This function of random module is used to generate random integers number of type np.int between low and high. Example: Output:
2
<type 'numpy.int32'>
array([[1, 1],
           [2, 5],
           [1, 3]])
5) np.random.random_sample([size]) This function of random module is used to generate random floats number in the half-open interval [0.0, 1.0). Example: Output: 0.09250360565571492 <type 'float'> array([0.34665418, 0.47027209, 0.75944969, 0.37991244, 0.14159746]) 6) np.random.random([size]) This function of random module is used to generate random floats number in the half-open interval [0.0, 1.0). Example: Output: 0.008786953974334155 <type 'float'> array([0.05530122, 0.59133394, 0.17258794, 0.6912388 , 0.33412534]) 7) np.random.ranf([size]) This function of random module is used to generate random floats number in the half-open interval [0.0, 1.0). Example: Output: 0.2907792098474542 <type 'float'> array([0.34084881, 0.07268237, 0.38161256, 0.46494681, 0.88071377]) 8) np.random.sample([size]) This function of random module is used to generate random floats number in the half-open interval [0.0, 1.0). Example: Output: 0.012298209913766511 <type 'float'> array([0.71878544, 0.11486169, 0.38189074, 0.14303308, 0.07217287]) 9) np.random.choice(a[, size, replace, p]) This function of random module is used to generate random sample from a given 1-D array. Example: Output: array([0, 3, 4]) array([2, 2, 2], dtype=int64) 10) np.random.bytes(length) This function of random module is used to generate random bytes. Example: Output: 'nQ\x08\x83\xf9\xde\x8a' PermutationsThere are the following functions of permutations: 1) np.random.shuffle() This function is used for modifying a sequence in-place by shuffling its contents. Example: Output: array([ 0, 1, 2, 3, 4, 5, 6, 7, 8, 9, 10, 11]) array([10, 3, 2, 4, 5, 8, 0, 9, 1, 11, 7, 6]) 2) np.random.permutation() This function permute a sequence randomly or return a permuted range. Example: Output: array([ 8, 7, 3, 11, 6, 0, 9, 10, 2, 5, 4, 1]) DistributionsThere are the following functions of permutations: 1) beta(a, b[, size]) This function is used to draw samples from a Beta distribution. Example: 2) binomial(n, p[, size]) This function is used to draw sample from a binomial distribution. Example: Output: array([6, 7, 7, 9, 3, 7, 8, 6, 6, 4]) 3) chisquare(df[, size]) This function is used to draw sample from a binomial distribution. Example: Output: array([6, 7, 7, 9, 3, 7, 8, 6, 6, 4]) 4) dirichlet(alpha[, size]) This function is used to draw a sample from the Dirichlet distribution. Example: Output: 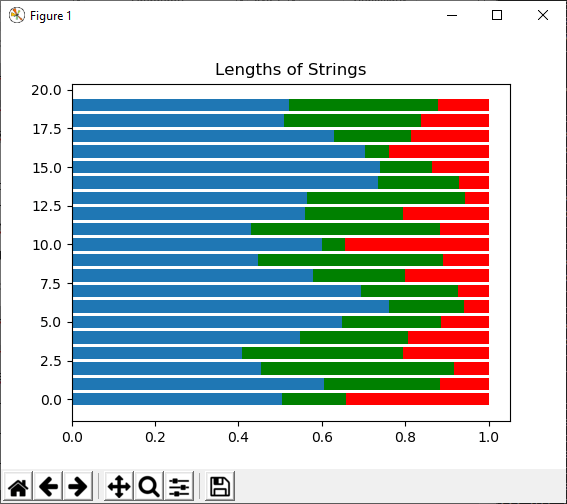
5) exponential([scale, size]) This function is used to draw sample from an exponential distribution. Example: 6) f(dfnum, dfden[, size]) This function is used to draw sample from an F distribution. Example: Output:
array([0.00264041, 0.04725478, 0.07140803, 0.19526217, 0.23979   ,
       0.24023478, 0.63141254, 0.95316446, 1.40281789, 1.68327507])
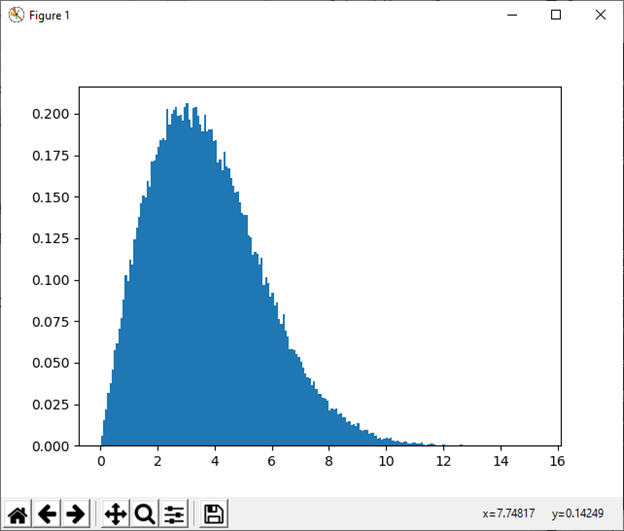
7) gamma(shape[, scale, size]) This function is used to draw sample from a Gamma distribution Example: 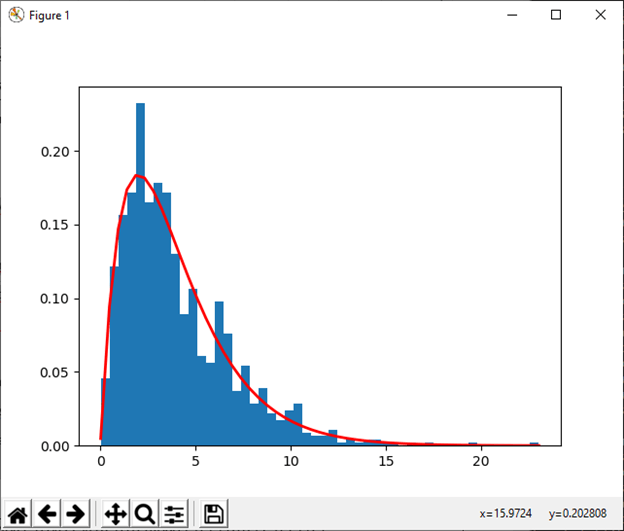
8) geometric(p[, size]) This function is used to draw sample from a geometric distribution. Example: Output: 3. 9) gumbel([loc, scale, size]) This function is used to draw sample from a Gumble distribution. Example: Output: 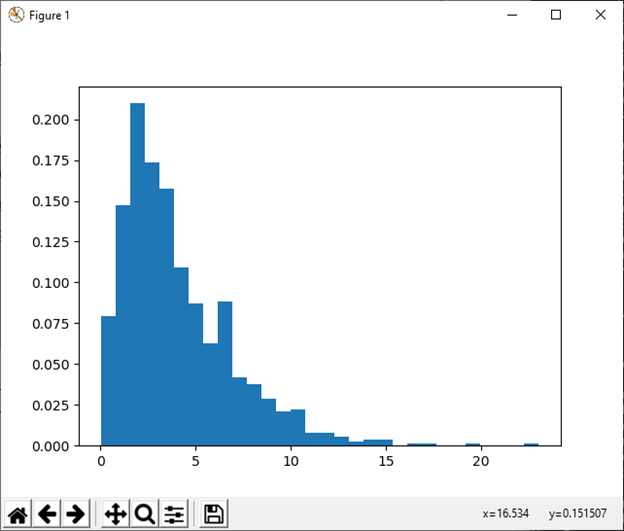
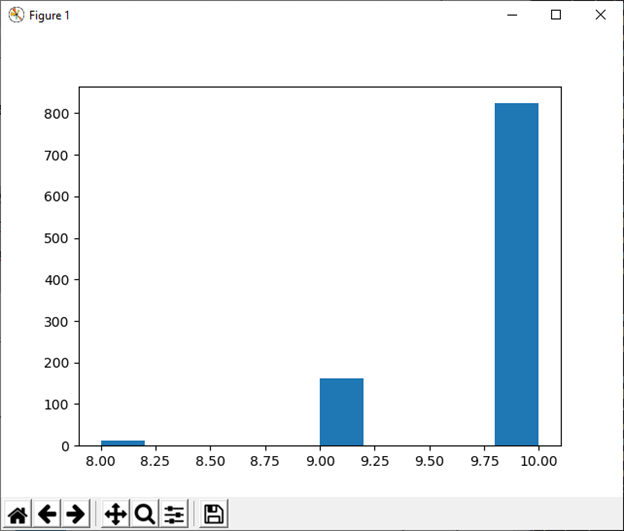
10) hypergeometric(ngood, nbad, nsample[, size]) This function is used to draw sample from a Hypergeometric distribution. Example: Output: (array([ 13., 0., 0., 0., 0., 163., 0., 0., 0., 824.]), array([ 8. , 8.2, 8.4, 8.6, 8.8, 9. , 9.2, 9.4, 9.6, 9.8, 10. ]), <a list of 10 Patch objects>)
11) laplace([loc, scale, size]) This function is used to draw sample from the Laplace or double exponential distribution with specified location and scale. Example: Output:
array([-2.77127948, -1.46401453, -0.03723516, -1.61223942,  2.29590691,
        1.74297722,  1.49438411,  0.30325513, -0.15948891, -4.99669747])
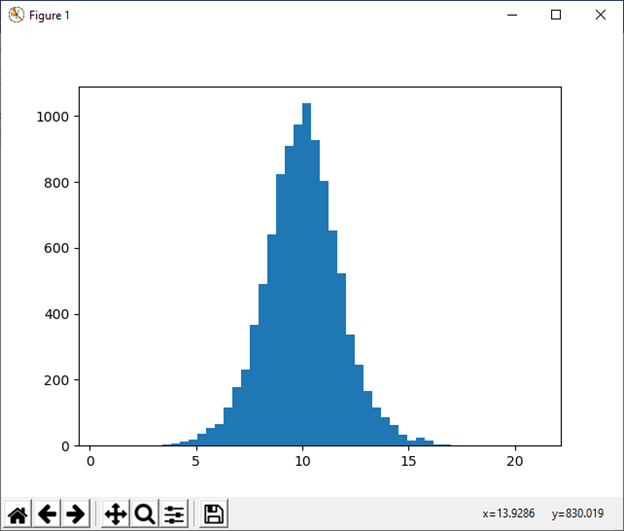
12) logistic([loc, scale, size]) This function is used to draw sample from logistic distribution. Example: Output:
array([1.000e+00, 1.000e+00, 1.000e+00, 0.000e+00, 1.000e+00, 1.000e+00,
       1.000e+00, 5.000e+00, 7.000e+00, 1.100e+01, 1.800e+01, 3.500e+01,
       5.300e+01, 6.700e+01, 1.150e+02, 1.780e+02, 2.300e+02, 3.680e+02,
       4.910e+02, 6.400e+02, 8.250e+02, 9.100e+02, 9.750e+02, 1.039e+03,
       9.280e+02, 8.040e+02, 6.530e+02, 5.240e+02, 3.380e+02, 2.470e+02,
       1.650e+02, 1.150e+02, 8.500e+01, 6.400e+01, 3.300e+01, 1.600e+01,
       2.400e+01, 1.400e+01, 4.000e+00, 5.000e+00, 2.000e+00, 2.000e+00,
       1.000e+00, 1.000e+00, 0.000e+00, 1.000e+00, 0.000e+00, 0.000e+00,
       0.000e+00, 1.000e+00])
array([ 0.50643911,  0.91891814,  1.33139717,  1.7438762 ,  2.15635523,
        2.56883427,  2.9813133 ,  3.39379233,  3.80627136,  4.2187504 ,
        4.63122943,  5.04370846,  5.45618749,  5.86866652,  6.28114556,
        6.69362459,  7.10610362,  7.51858265,  7.93106169,  8.34354072,
        8.75601975,  9.16849878,  9.58097781,  9.99345685, 10.40593588,
       10.81841491, 11.23089394, 11.64337298, 12.05585201, 12.46833104,
       12.88081007, 13.2932891 , 13.70576814, 14.11824717, 14.5307262 ,
       14.94320523, 15.35568427, 15.7681633 , 16.18064233, 16.59312136,
       17.00560039, 17.41807943, 17.83055846, 18.24303749, 18.65551652,
       19.06799556, 19.48047459, 19.89295362, 20.30543265, 20.71791168,
       21.13039072])
<a list of 50 Patch objects>
13) lognormal([mean, sigma, size]) This function is used to draw sample from a log-normal distribution. Example: Output: 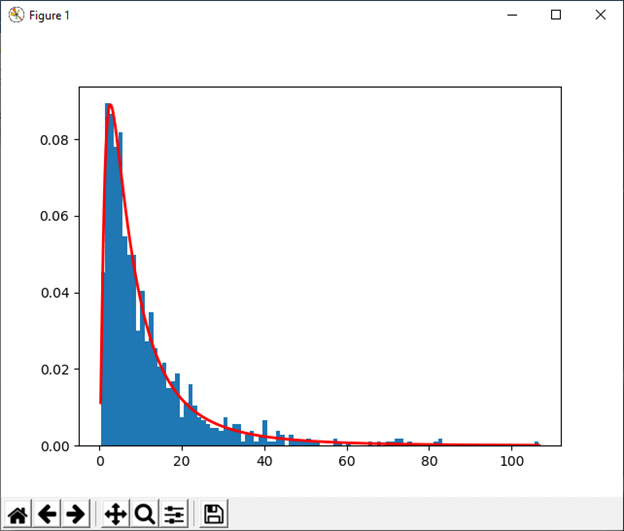
14) logseries(p[, size]) This function is used to draw sample from a logarithmic distribution. Example: Output: 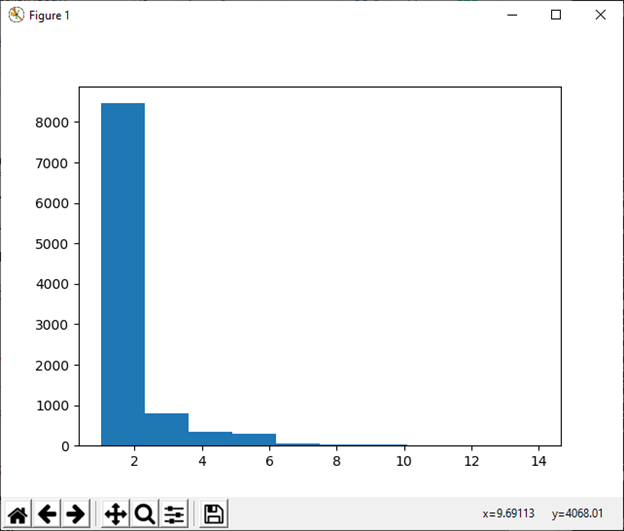
15) multinomial(n, pvals[, size]) This function is used to draw sample from a multinomial distribution. Example: Output: array([[4, 2, 5, 5, 3, 1]]) 16) multivariate_normal(mean, cov[, size, ...) This function is used to draw sample from a multivariate normal distribution. Example: Output: 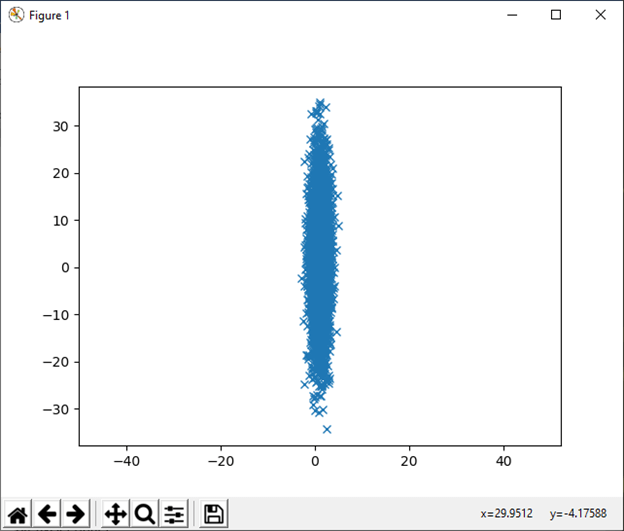
17) negative_binomial(n, p[, size]) This function is used to draw sample from a negative binomial distribution. Example: Output: 1 wells drilled, probability of one success = 0 2 wells drilled, probability of one success = 0 3 wells drilled, probability of one success = 0 4 wells drilled, probability of one success = 0 5 wells drilled, probability of one success = 0 6 wells drilled, probability of one success = 0 7 wells drilled, probability of one success = 0 8 wells drilled, probability of one success = 0 9 wells drilled, probability of one success = 0 10 wells drilled, probability of one success = 0 18) noncentral_chisquare(df, nonc[, size]) This function is used to draw sample from a noncentral chi-square distribution. Example: Output: 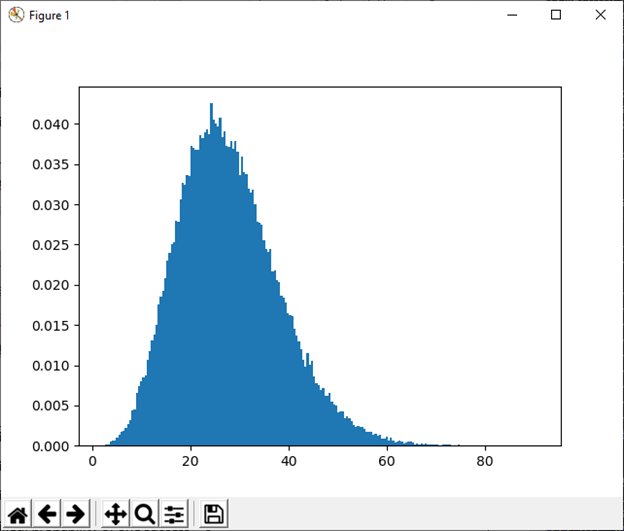
19) normal([loc, scale, size]) This function is used to draw sample from a normal distribution. Example: Output: 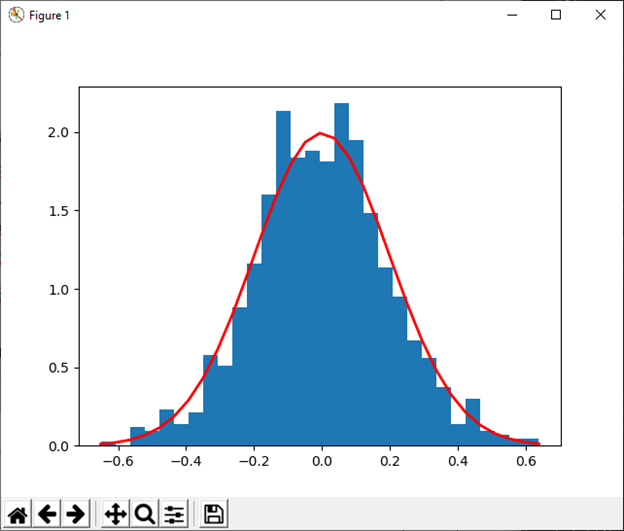
20) pareto(a[, size]) This function is used to draw samples from a Lomax or Pareto II with specified shape. Example: Output: 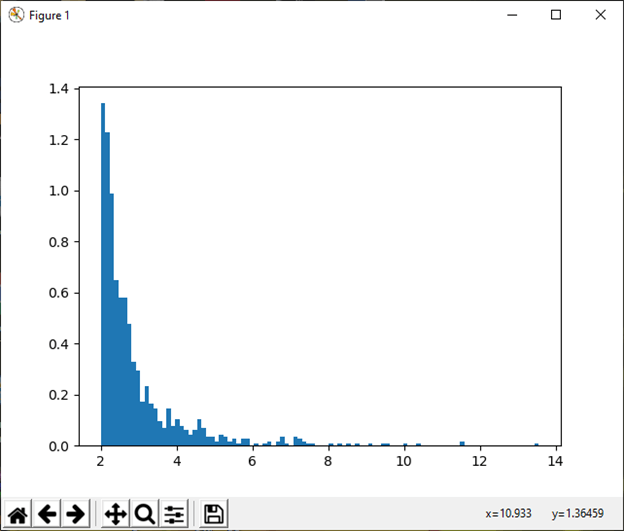
21) power(a[, size]) This function is used to draw samples in [0, 1] from a power distribution with positive exponent a-1. Example: Output: 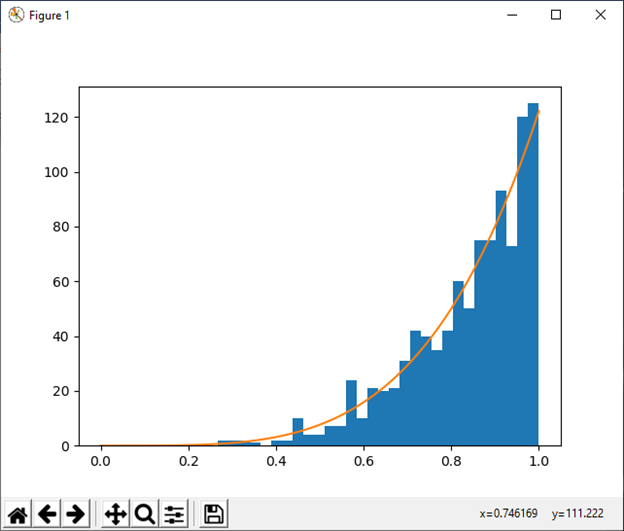
22) rayleigh([scale, size]) This function is used to draw sample from a Rayleigh distribution. Example: Output: 0.087300000000000003
23) standard_cauchy([size]) This function is used to draw sample from a standard Cauchy distribution with mode=0. Example: Output: 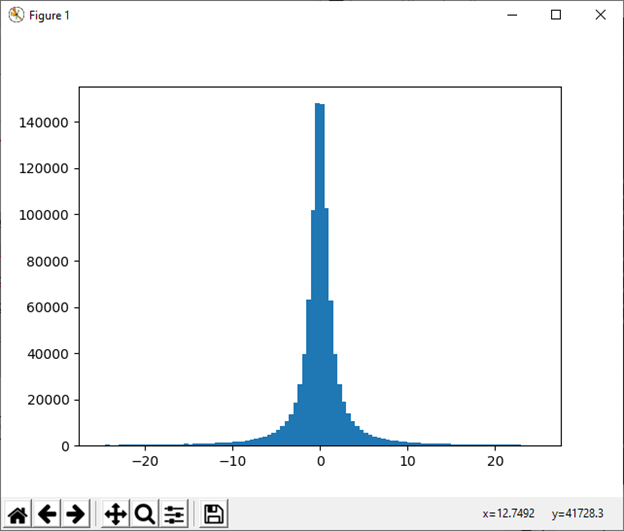
24) standard_exponential([size]) This function is used to draw sample from a standard exponential distribution. Example: Output:
array([[0.53857931, 0.181262  , 0.20478701, ..., 3.66232881, 1.83882709,
        1.77963295],
       [0.65163973, 1.40001955, 0.7525986 , ..., 0.76516523, 0.8400617 ,
        0.88551011]])
25) standard_gamma([size]) This function is used to draw sample from a standard Gamma distribution. Example: Output: 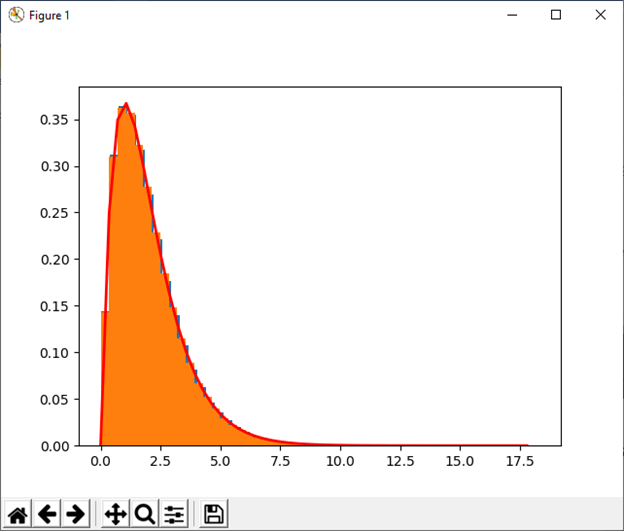
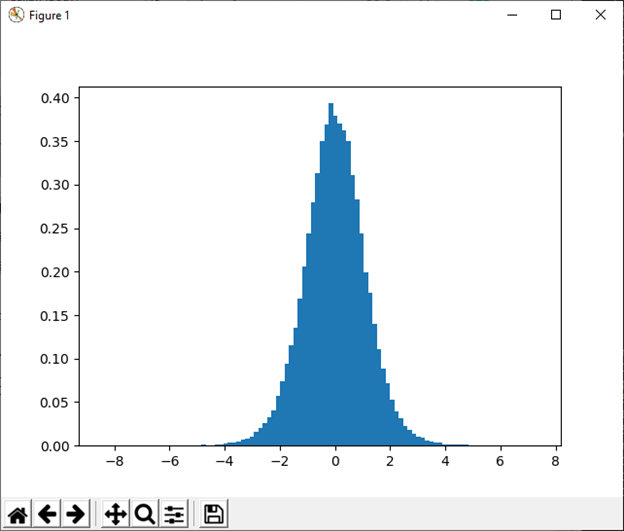
26) standard_normal([size]) This function is used to draw sample from a standard Normal distribution. Example: Output:
array([-3.14907597,  0.95366265, -1.20100026, ...,  3.47180222,
        0.9608679 ,  0.0774319 ])
array([[[ 1.55635461, -1.29541713],
        [-1.50534663, -0.02829194],
        [ 1.03949348, -0.26128132],
        [ 1.51921798,  0.82136178]],

       [[-0.4011052 , -0.52458858],
        [-1.31803814,  0.37415379],
        [-0.67077365,  0.97447018],
        [-0.20212115,  0.67840888]],

       [[ 1.86183474,  0.19946562],
        [-0.07376021,  0.84599701],
        [-0.84341386,  0.32081667],
        [-3.32016062, -1.19029818]]])
27) standard_t(df[, size]) This function is used to draw sample from a standard Student's distribution with df degree of freedom. Example: Output: 6677.5 1174.1101831694598 0.00864
28) triangular(left, mode, right[, size]) This function is used to draw sample from a triangular distribution over the interval. Example: Output: 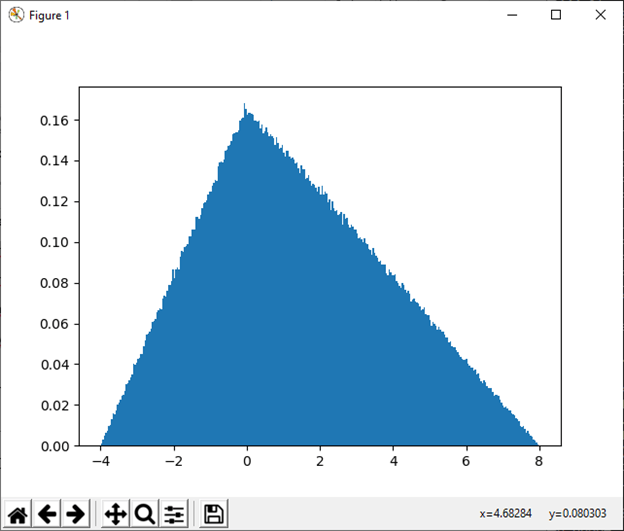
29) uniform([low, high, size]) This function is used to draw sample from a uniform distribution. Example: Output: 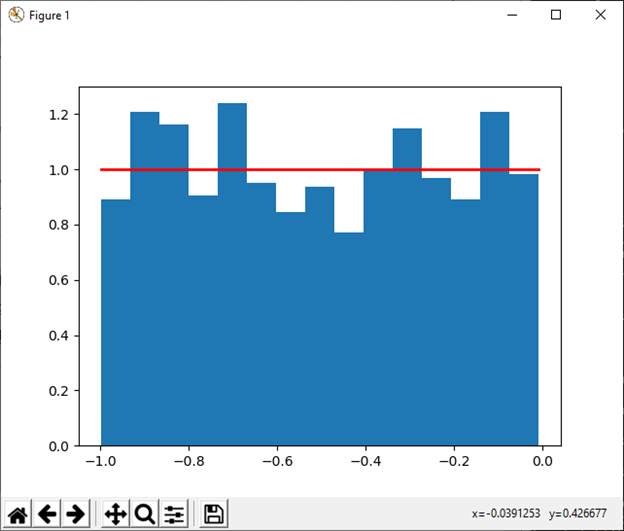
30) vonmises(m1, m2[, size]) This function is used to draw sample from a von Mises distribution. Example: Output: 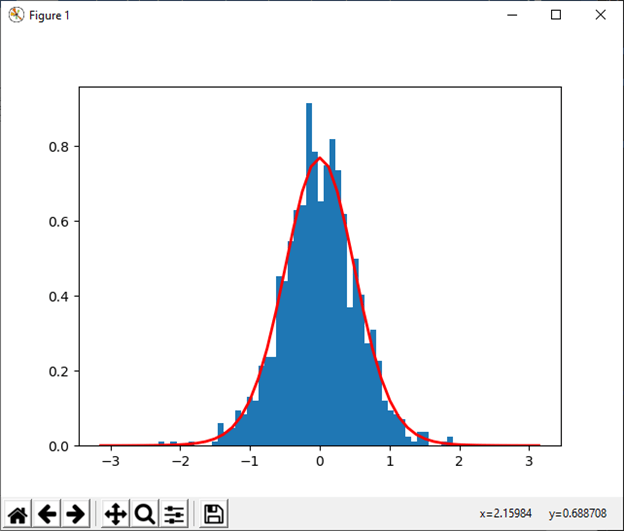
31) wald(mean, scale[, size]) This function is used to draw sample from a Wald, or inverse Gaussian distribution. Example: Output: 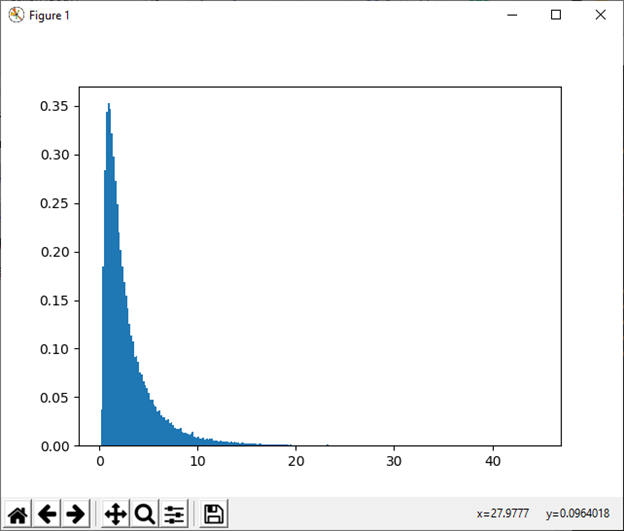
32) weibull(a[, size]) This function is used to draw sample from a Weibull distribution. Example: Output: 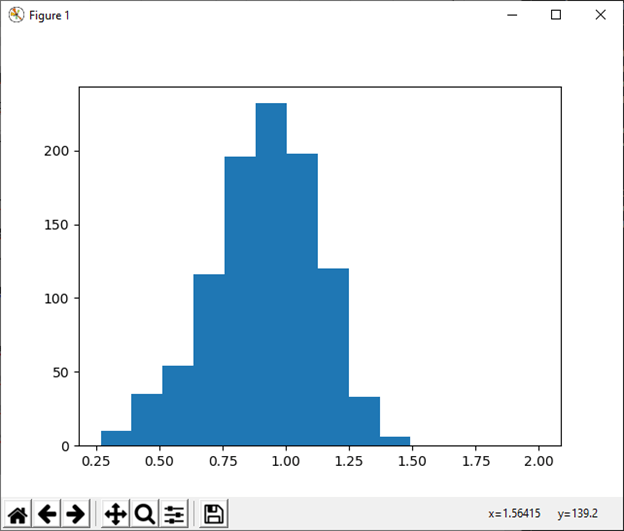
33) zipf(a[, size]) This function is used to draw sample from a Zipf distribution. Example: Output: 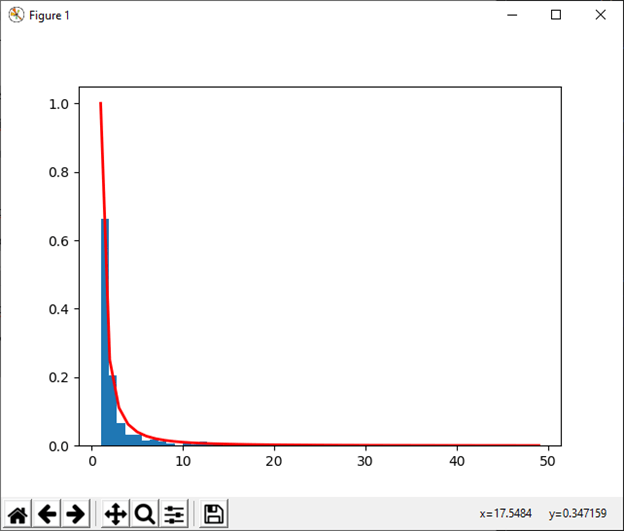
Next Topicnumpy.zeros()
|
 For Videos Join Our Youtube Channel: Join Now
Feedback
- Send your Feedback to [email protected]
Help Others, Please Share


