| |

Web GraphicsThe graphic that we use over the web is termed as Web Graphic. To make an informed decision about web graphics, we need to consider the following guidelines:
Pixel Preview ModeAdobe Illustrator rasterizes the artwork at 72 pixels per inch when we save artwork in a bitmap format - such as JPEG, GIF, or PNG. You can see the preview of the objects when rasterizing by clicking on the View menu → Pixel Preview. 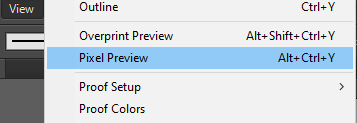
To see the way Illustrator divides objects into pixels, follow these steps: Step 1: Open the Illustrator file that contains the vector objects. Step 2: Go to the view menu then click on the Pixel Preview from the drop-down. Step 3: Now, magnify the artwork to see its individual pixels. 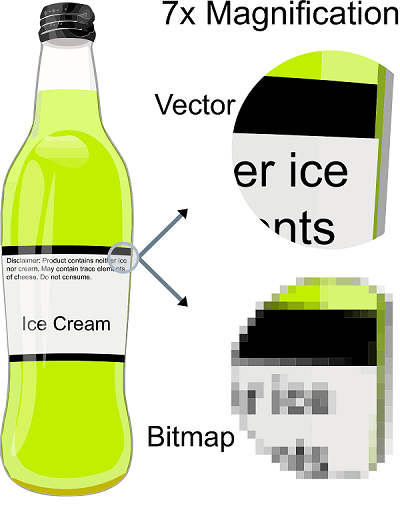
An invisible grid can be used by the Illustrator to determine the placement of pixels that divides the artboard into 1/72 inch. Slices and image mapsWeb pages contain a number of elements such as HTML text, bitmap images, and vector graphics. We can use the slices to define the boundaries of different web elements in our artwork. For Example: If you want to create an artwork that needs to be optimized in JPEG format while the rest of the image is better optimized as a GIF file, then you can isolate the bitmap image using a slice. Slice: It is an Illustrator document that corresponds to a table cell in the resulting web page. The slice is an exported image file that is enclosed in a table cell by default. 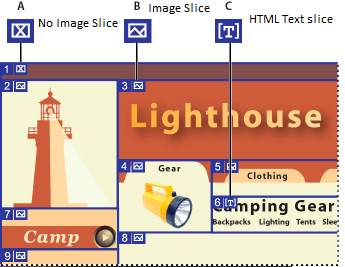
To view the slices, you can go to the artboard and Save For Web & Devices dialogue box. The slices can be numbered from left to right and from top to bottom. The slice numbers are updated to reflect the new order if we change the arrangement or a total number of slices. There are two types of automatic slices:
How to create Slices Step 1: Open the artboard and select the object you want to create a slice for. Step 2: Select the slice tool and drag over the area where you want to create the slice. 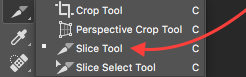
Step 3: Now, go to the Create From Selection command, or the Create From Guides command. Adobe Device CentralIt can be used to enable Illustrator users to preview how the files will look on a variety of mobile devices. For Example - We can use Illustrator to design a wallpaper for mobile phones. After we create the file, we can easily test the file on a wide variety of phones. Then we will make the adjustment accordingly. 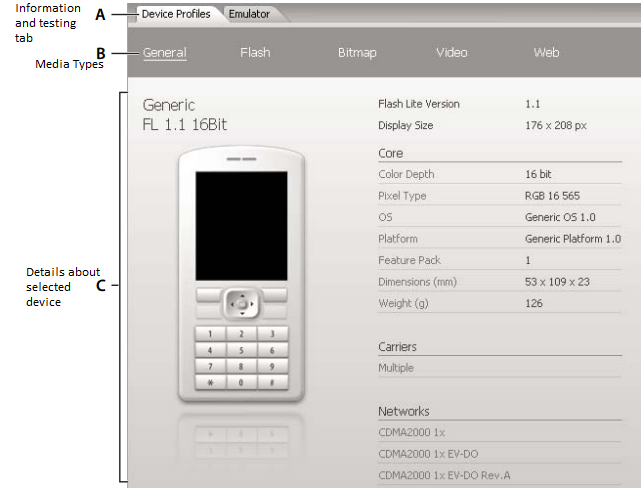
How to access Illustrator from Adobe Device Central Step 1: Go to the Start menu and start the Adobe Device Central. Step 2: Now, open the explorer and select the file. Step 3: After that, make the necessary changes, such as selecting a Player Version, Display Size, Flash Version, or Content-type. Step 4: For all the selected devices option, select the custom size, and add the width and height. Step 5: If multiple devices will be selected, the device central selects a size for you. To select a different size, you need to click on different devices or set of devices. Step 6: Finally, click on Create. How to create an illustrator image for mobile devices If you want to optimize the image for mobile devices, then save the artwork in any SVG format, which is designed for mobile devices. Follow these tips to view the images on mobile devices. 1. To create the content, use the SVG standard. It can be used to publish the vector graphics on mobile devices in a very small file size. 
2. You have to work from the beginning within the final dimensions of your target mobile device. 3. You have to the color mode of the Illustrator to RGB because SVG can be viewed on RGB raster display devices. 4. Try reducing the number of objects to reduce the file size. 5. Whenever possible, use symbols to define the vector that describes an object once instead of multiple times. 6. Try to reuse the objects and less number of objects when animating the graphics. 7. Consider using the compressed version of SVG that is SVGZ. Create Animation in Adobe IllustratorTo create an animation in Adobe Illustrator, we need to save the file in the Flash file format (SWF), which is vector-based. The artwork we created in Illustrator can maintain its image quality at any resolution and ideal for the creation of animation frames. The artwork can be saved as an SWF file using the export command, or you can use Save For Web & Device command. Points to remember while preparing artwork to Save as SWF:
There are many ways to create Flash animations in Illustrator. The easiest way is to place each animation frame on a separate Illustrator layer. Step 1: Open Adobe Illustrator and create an artwork you want to animate. Step 2: You should use the symbols to reduce the file size of the animation and simplify your work. Step 3: For each frame in the Illustrator, create a separate layer. 
Step 4: Order the layers in a way you want to display them as an animation frame. 
Step 5: Now, go to the File menu and click on Export from the drop-down menu. 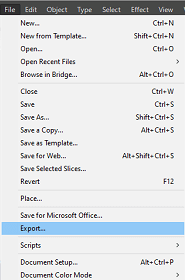
Step 6: On the export file dialogue box, select the Flash format (SWF) and click on the Export button. 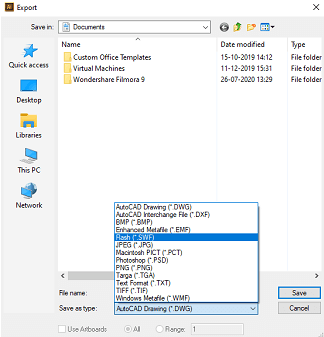
Step 7: Set the additional options available on the dialogue box and click OK. Creating a Graph in IllustratorUsing graphs, we can visualize the statistical information. We can create nine different types of graphs in Adobe Illustrator and can customize them according to our needs. To create different types of graphs, you can go to the Tools panel and click and hold the mouse on the Graph tool to see different graph options. Step 1: Open the artboard on which you want to create the graph. Step 2: Go to the Tools panel and select a graph tool. 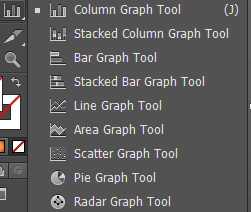
Step 3: Click anywhere on the artboard from where you want to begin the graph and drag your pointer diagonally. 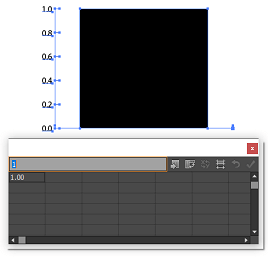
Step 4: Now, enter data for the graph in the Graph Data window. 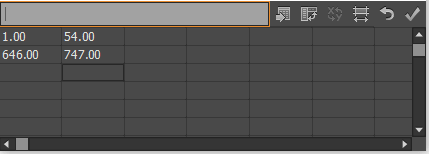
Step 5: Press Enter key on the numeric keypad to create the graph or click on the Apply button. Adjust column width or decimal precision If you adjust the column width, it has no effect on the width of columns in the graph and allows only to view more or fewer digits in a column. If the default value will be two decimals, the number 4 entered in a cell appear in the Graph Data Window box 4.00. Step 1: Click on the Cell Style button 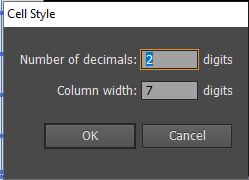
Step 2: Enter a value between 0-20 in the column Width text box. Enter Graph Data To enter the data for your graph, you will use the Graph Data window. It appears automatically when you use a graph too and keep it open. Step 1: Select the Selection tools from the tools panel and then go to the object menu. Step 2: From the drop-down menu, select the graph and data from the sub-menu. 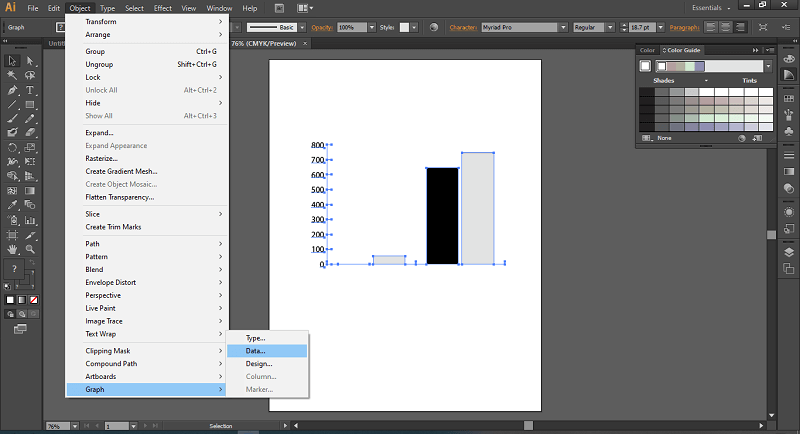
Step 3: Enter the data by selecting a cell from the worksheet and press enter. 
Step 4: Finally, click on the Apply button. How to use graph labels and data setsLabels: The words or numbers that describe two things: the set of data we want to compare and the categories across which we want to compare them. To enter labels in the worksheet, follow these steps: For column, bar, line, area, and radar graph.
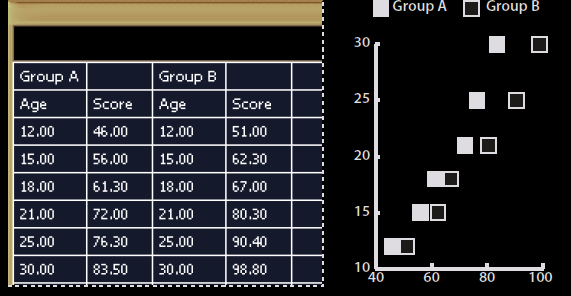
Enter data sets for scatter graphsThe scatter graphs are different from other graphs in both axes measure values.
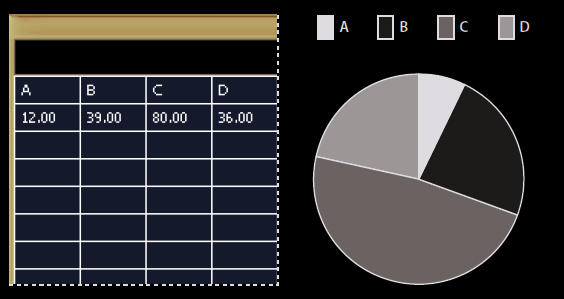
Enter data sets for pie graphs
Enter data sets for the column, bar, area, line, and radar graph The length of the bar and height of the column corresponds to the amount being compared. We can combine positive and negative values for a column or bar graph. Line Graph: In the line graph, each column of data corresponds to one line. We can the values in the line graph as positive and negative. Area graph: All the values must be positive or negative. On the area graph, each row of data entered corresponds to a filled area on the area graph. Radar graphs: Each number is connected to the other and plotted on an axis. The positive and negative values can be combined in the radar graph.
Next TopicAdobe Illustrator Printing
|

 For Videos Join Our Youtube Channel: Join Now
Feedback
- Send your Feedback to [email protected]
Help Others, Please Share


