| |

How to Generate JVM Heap Memory Dump?All Java objects that really are present in the JVM (Java Virtual Machine) at a specific moment in time are captured in a Java Heap dump. In the heap memory, the JVM allocates space for objects that are arrays or class instances. The Garbage Collector launches and frees up the memory space used by the objects when they are no longer be required or referenced. A heap dump is a record of all of the objects the JVM has in memory at a certain time. They are highly helpful for optimising memory utilisation in Java programmes and troubleshooting memory-leak issues. The heap dump has a. hprof extension and is in binary format. With the aid of programmes like JVisualVM and Eclipse MAT, it may be viewed and examined (Memory Analyzer Tool). To find problems like buffer overflows and to improve memory usage in our programme, we create java memory heap dumps. Hprof files in binary format are typically used to store heap dumps. These files can be opened and examined using programmes such jhat or JVisualVM. Additionally, using MAT is a frequent practise among Eclipse users. In the sections that follow, we'll go over various methods and tools for creating a heap dump and highlight the key differences between them. Methods:A java memory stack dump can be created in a variety of ways. JDK has developed a number of tools for creating heap dumps. These resources can be found in the bin folder of the JDK home directory. Let's talk about how to create a JVM Heap Dump, which goes like this:
1. Using the Map CommandWe can execute the command jmap in our JDK home directory's bin folder. It provides data about memory use. The following is the structure: Output: 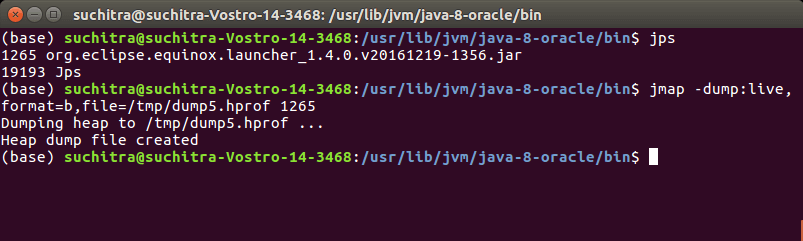
Method 2: Using the terminal's jcmd commandWith this command, the JVM is asked to create a heap dump. Heap dump, one of its parameters, is called GC. It is as follows: Output: 
Method 3: Using the JVisualVM ToolThis particular utility is included with JDK. Monitoring and troubleshooting java apps is helpful. It offers a straightforward, user-friendly graphical user interface. In the start menu, we type jvisualvm, or under a command prompt or terminal window in Unix, we navigate to the bin directory of the JDK home directory and type jvisualvm. A Java Visual VM programme is started. It displays the Java process that is now active on the left. Right-click the process ID we want to create a heap dump for. When we select the heap dump option, the heap dump again for chosen process is generated. This file path in which the heap dump is produced is displayed under Basic info. 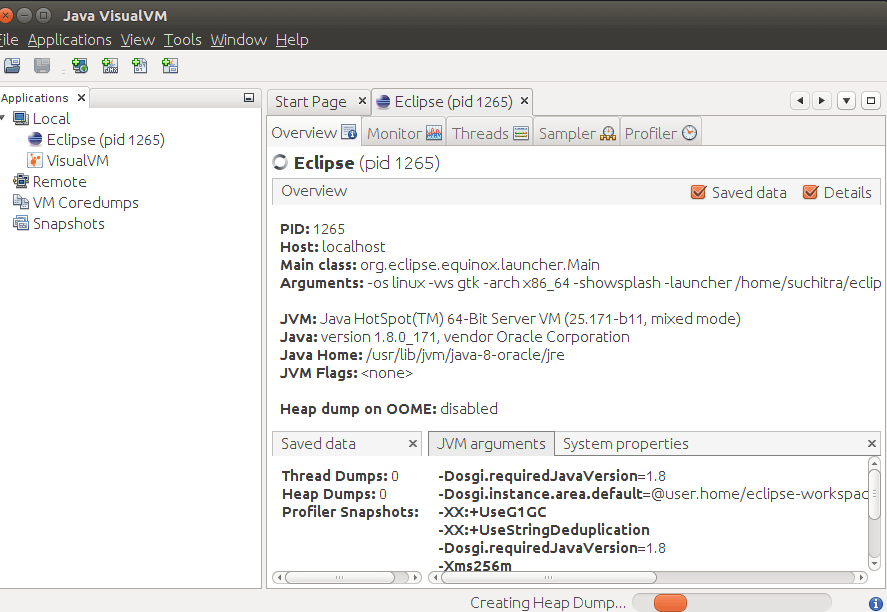
Method 4: Identifying HeapDumpOnOutOfMemoryWhen a java. lang issue arises in an application, heap dumps should ideally be recorded. OutOfMemoryError. Heap dumps make it possible to see which living items are now active in the memory and how much of it they occupy. When this system option is set, JVM will take a copy of the heap dump while executing our Java program whenever it gets an OutOfMemoryError. Method 5: Using JMX Console:There is a heap dump procedure in the Hotspot Diagnostic MBean. To call the MBean operation, we use jmx consumers like jconsole. Using JConsole, we may specify the host, port number, username, and password to connect to either a local Java program or a remote Java process. Multiple tabs for the jconsole applications open when we link to the process id. Heap Memory utilisation, threads, classes, and CPU usage are displayed in the Overview tab. |
 For Videos Join Our Youtube Channel: Join Now
Feedback
- Send your Feedback to [email protected]
Help Others, Please Share


