Monitoring APIs with Spring Boot ActuatorSpring Boot ActuatorSpring Boot provides the actuator to monitor and manage applications effectively. It is a tool that has HTTP endpoints (the place where the resource lives). It is a sub-project of Spring Boot. It adds several production grade services to our application with less effort. If the performance of a service goes down or failure, we should know the reason as quickly as possible. We need to build monitoring around the API, especially when we build microservices. Spring Boot has great support to provide monitoring. To use the production-ready features, we will add spring-boot-actuator dependency in pom.xml. Let's add monitoring service in our Spring Boot project. Step 1: Open pom.xml and add the following dependencies: Spring Boot Starter Actuator: It provides a lot of monitoring facilities around your services. Spring Data Rest HAL Browser: HAL makes our API exportable, and its documentation easily discoverable from within the API itself. Hypertext Application Language (HAL) is a simple language that gives a consistent and easy way to hyperlink between resources in API. The spring boot starter actuator is actually in the HAL format. HAL browser searches for APIs and identifies the links. It shows the link on the screen so that we can easily browse through the API. Step 2: Restart the application. Start 3: Type the URL localhost:8080/actuator in the browser and hit the enter key. If it does not work, use the URL localhost:8080/application. It launches the actuator that shows the three URLs: self, health, and info. When we click on the health URL, it shows the health of the application. In the following image, status up denotes that application is running. 
When we click on the info URL, it shows the information of the application. A pair of blank curly braces denote that there is no information is available. 
To enable the information, we need to configure the property.
It shows a lot of URLs. The HAL BrowserTo access the HAL browser, type localhost:8080 in the browser and hit the enter key. 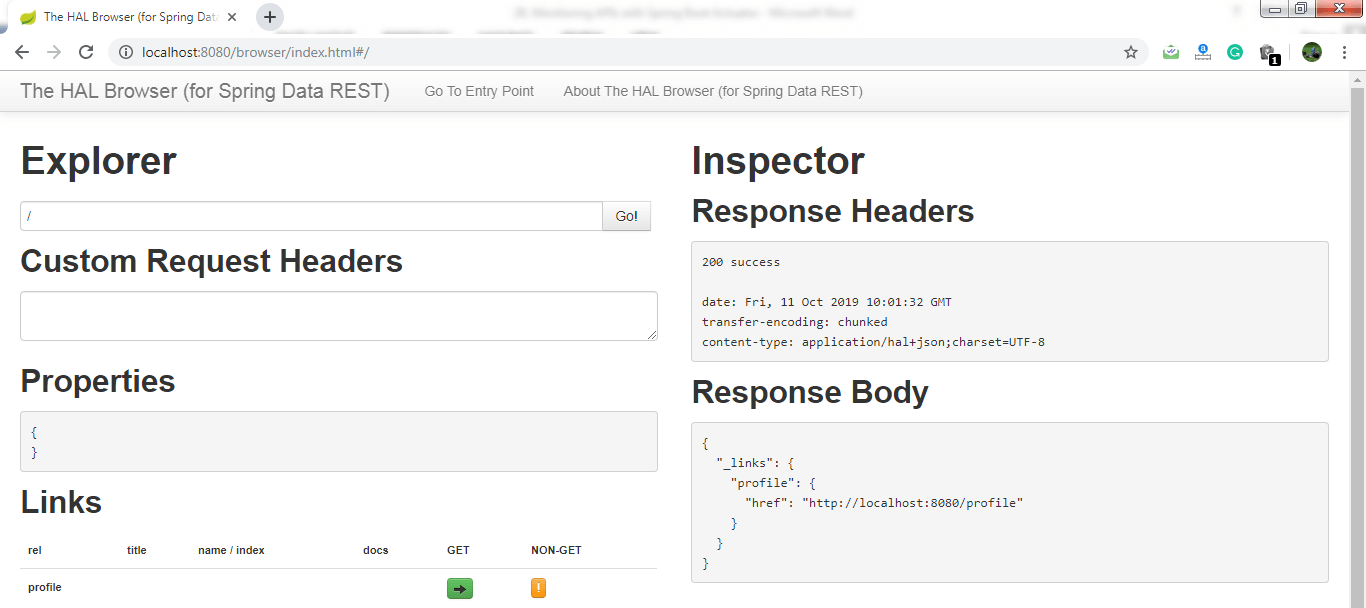
Now we can access the actuator through the HAL browser. Type /actuator in the Explorer's text box and click on the Go button. 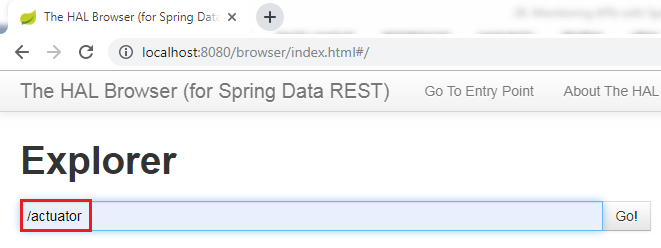
It shows all the things related to the actuator. The most important thing in the actuator is beans. 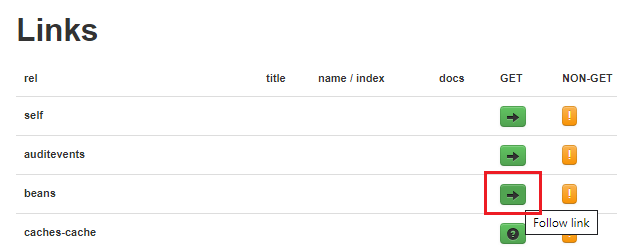
When we click on the bean's arrow, it shows all the beans configured in the spring boot project. 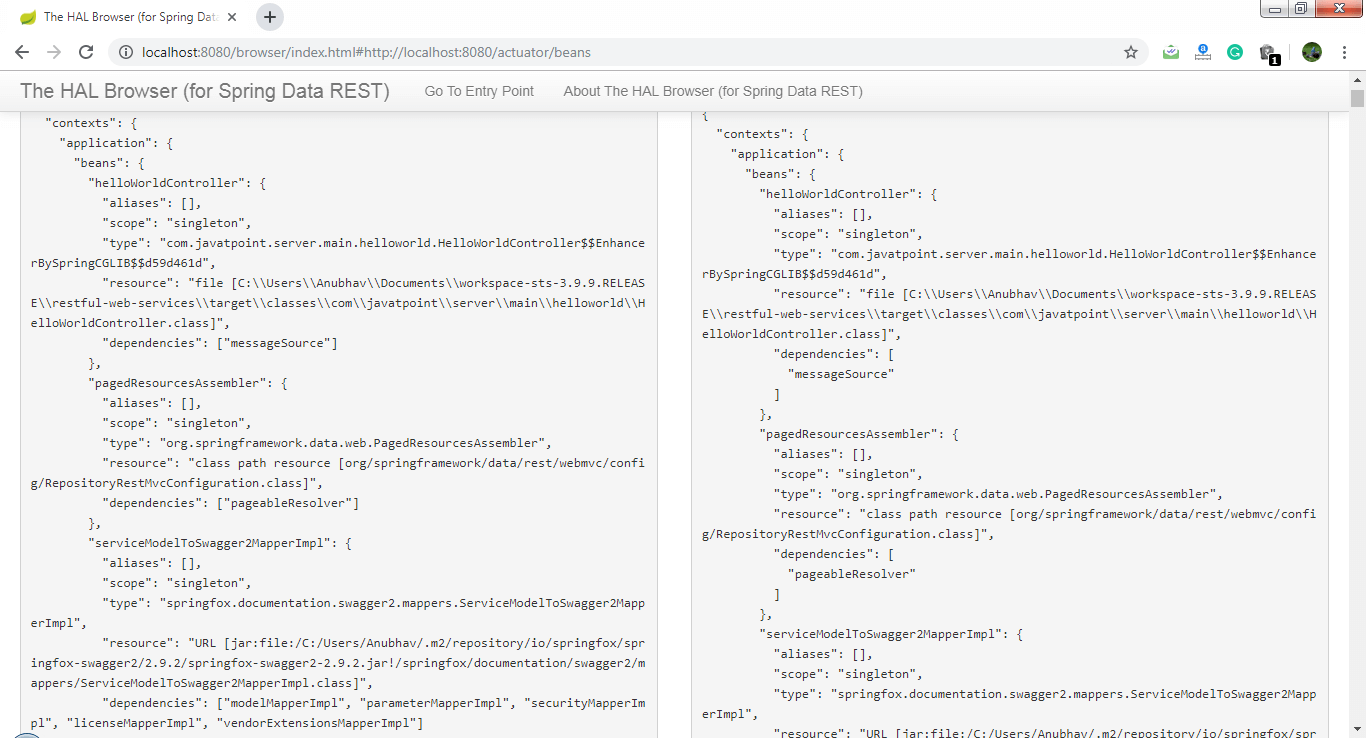
If we want to check the status of the application, we can click on the health link. 
It shows the health of the application. 
There is another link in the actuator named metrics. It shows the list of valid metrics. 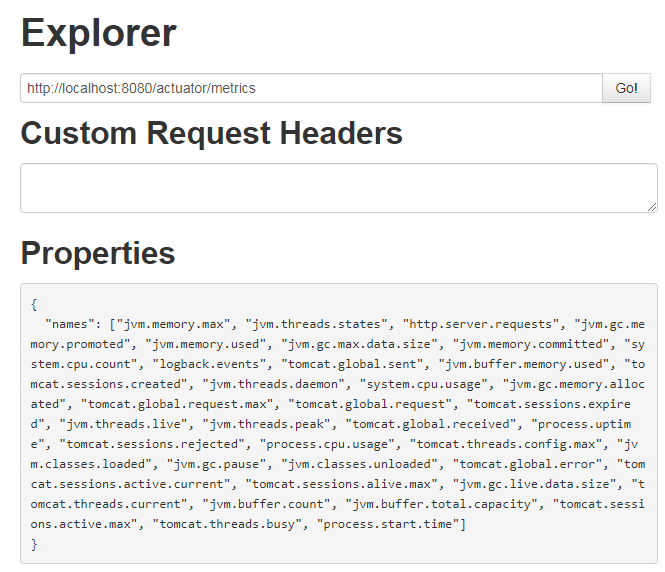
Suppose we want to know how much memory is used by the application. We have accessed /jvm.memory.max. 
In the following image, the value indicates the maximum memory used by the application. 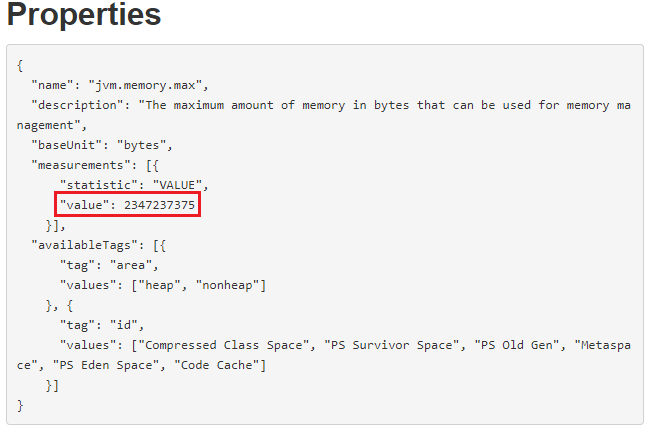
There are two important links httptrace and mapping that are present in the actuator. 
The httptrace shows all the requests that we have executed earlier. We can see all the details of previously executed requests, as shown below: 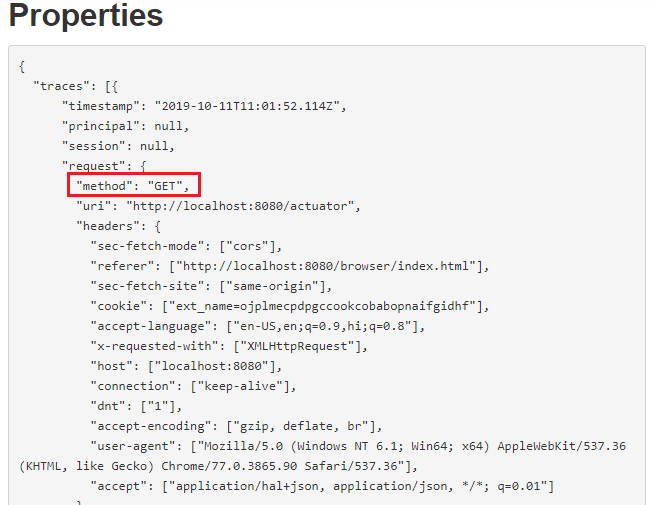
The mapping shows all the different things that are mapped to URLs. Whenever we are creating web services or web applications, we are mapping a lot of URLs. 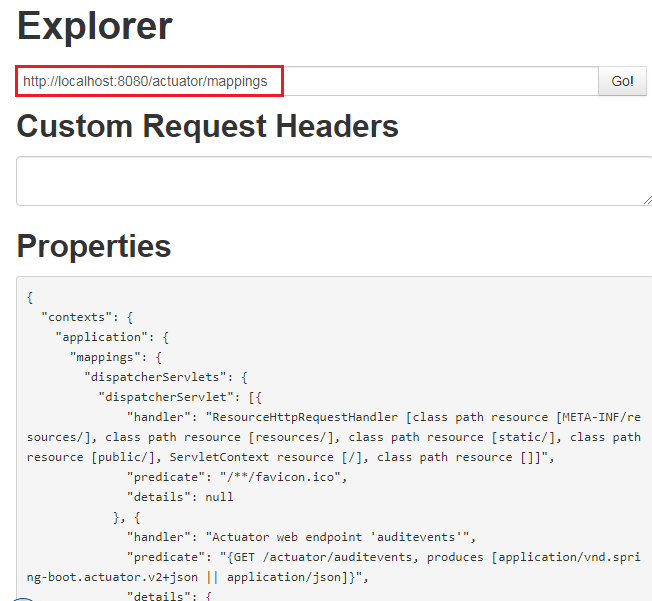
In this section, we have learned what we can do with the actuator. |
 For Videos Join Our Youtube Channel: Join Now
Feedback
- Send your Feedback to [email protected]
Help Others, Please Share


