| |

JFreeChart- Bubble ChartA bubble chart represents information in a three-dimensional manner. This chart is a variation of a scatter chart(XY chart) in which the data points are replaced by bubbles, and an additional dimension (z-values) of the data is represented in the size of the bubbles. The following images show some of the demo versions of Bubble chart incorporated in JFreeChart library: Bubble Chart Demo 1: 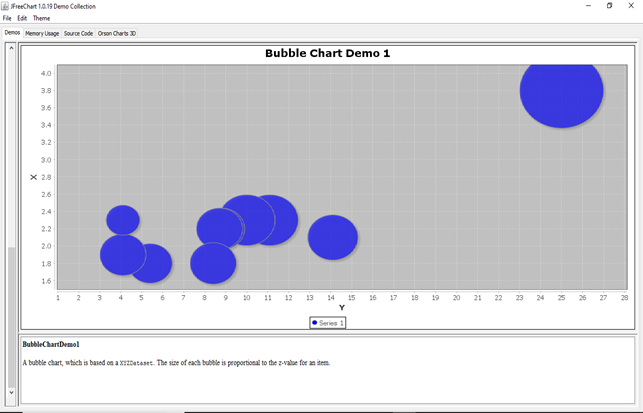
Bubble Chart Demo 2: 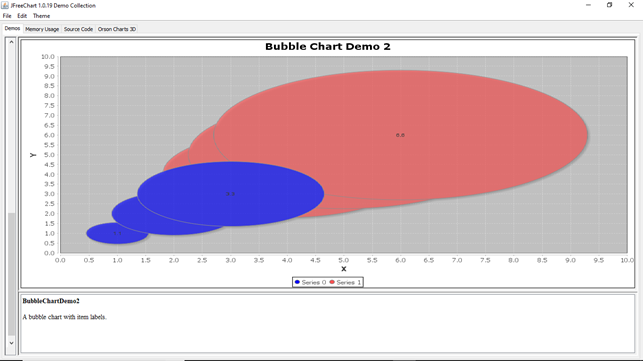
Bubble chart example:Let us consider the following sample data for a bubble chart.
The following codes create a Bubble chart from the above sample data: BubbleChartExample.javaOutput: 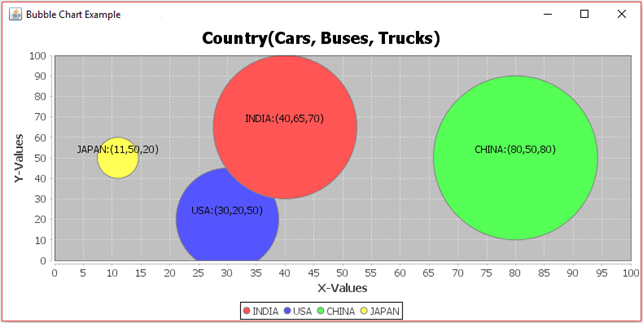
Next TopicJfreeChart-TimeSeries Chart
|
 For Videos Join Our Youtube Channel: Join Now
Feedback
- Send your Feedback to [email protected]
Help Others, Please Share


Like/Subscribe us for latest updates or newsletter 


