| |

JFreeChart-Pie ChartA pie chart is a circular graph which is divided into sectors in which the area of each sector represents the size of the data. The following images show some of the demo versions of pie chart incorporated in JFreeChart library: Pie Chart Demo 1: 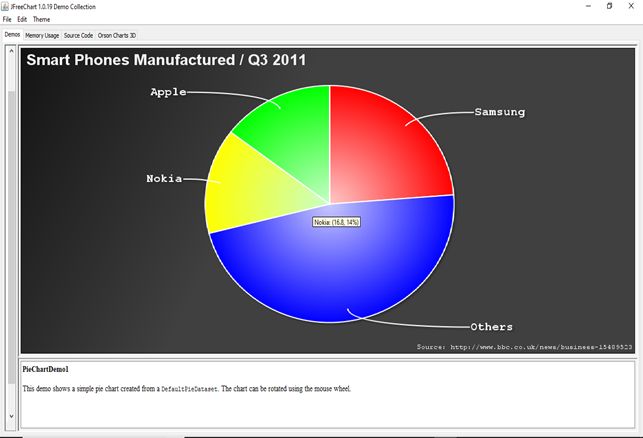
Pie Chart Demo 2: 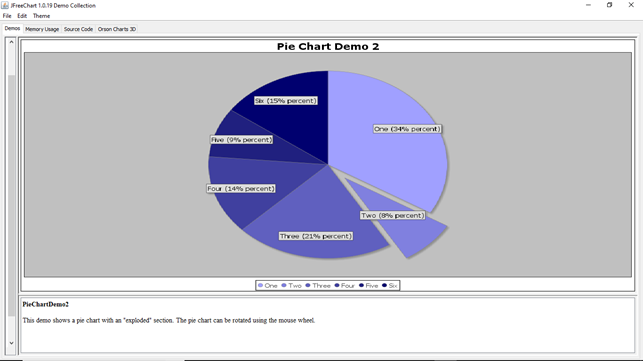
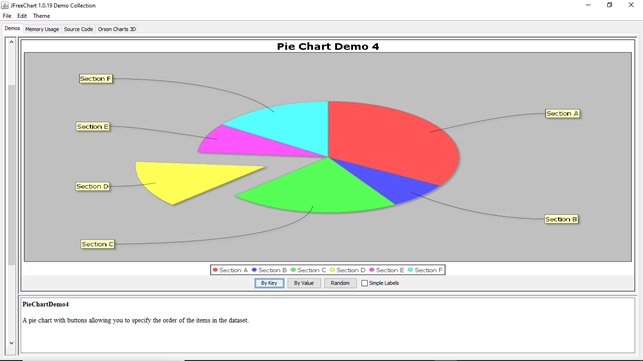
Pie Chart Demo 4:
Pie Chart exampleLet us consider a sample data of marks distribution for a class.
The following codes create a pie chart from the above sample data: PieChartExample.javaOutput: 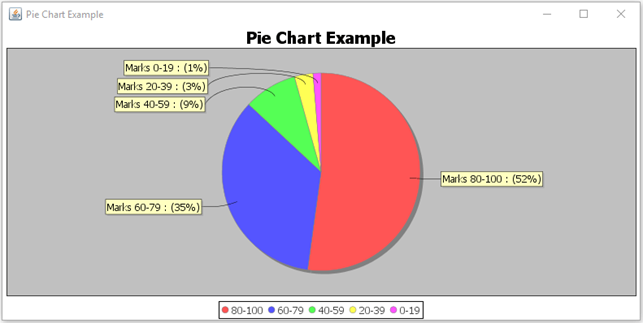
Next TopicJfreeChart-Bar Chart
|
 For Videos Join Our Youtube Channel: Join Now
Feedback
- Send your Feedback to [email protected]
Help Others, Please Share


Like/Subscribe us for latest updates or newsletter 


