| |

JFreeChart- Scatter ChartA scatter chart or plot contains a set of data points plotted on horizontal and vertical axes. It displays data from a XYDataset. The following images show some of the demo versions of Scatter chart incorporated in JFreeChart library: Scatter Plot Demo 1: 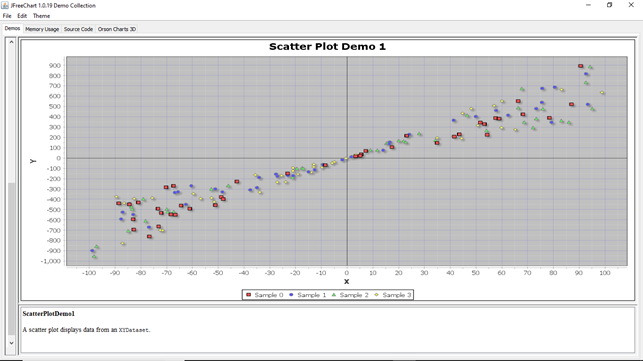
Scatter Plot Demo 2: 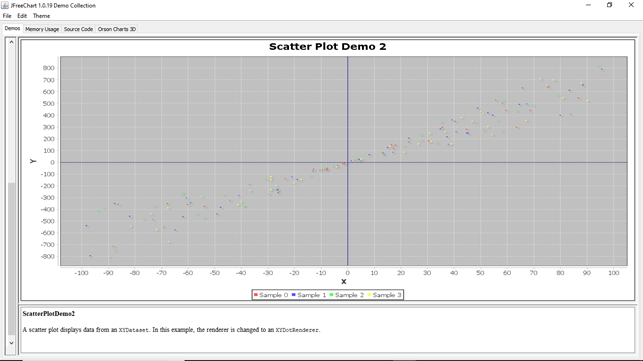
Scatter Plot Demo 3: 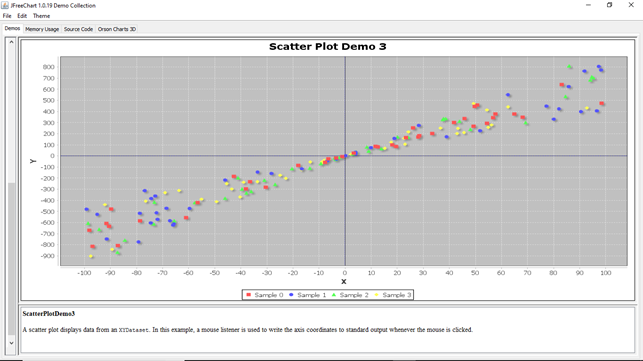
Scatter Plot example:Let us consider the following sample data for a scatter plot.
The following codes create a scatter plot from the above sample data: ScatterPlotExample.javaOutput: 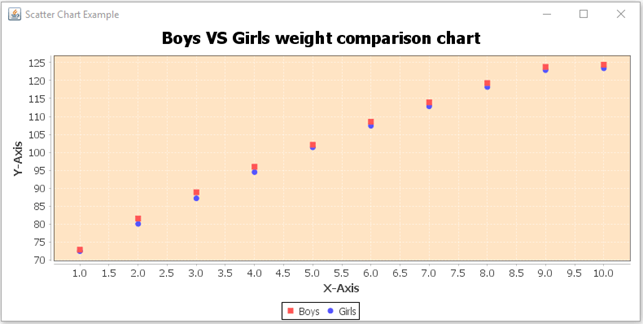
Next TopicJfreeChart-Bubble Chart
| ||||||||||||||||||||||||||||||||||||||||||||||||
 For Videos Join Our Youtube Channel: Join Now
Feedback
- Send your Feedback to [email protected]
Help Others, Please Share


Like/Subscribe us for latest updates or newsletter 


