| |

Splunk- DashboardIn this section, we are going to learn about How to create and manage the dashboard in our Splunk platform. Here we will learn how we can add different saved reports into our dashboard and what features we can add in our dashboard in order to see the different insights. Along with this, we will also learn how to set different privileges and charts in dashboard and its reports. About dashboardsThe dashboards are views which consist of panels. The panels can include such modules as search boxes, fields, maps, tables, and lists. Usually, the dashboard panels are connected to the reports. We can add it to a new or current Dashboard after we create a search visualization or save a post. Additionally, we can use a Dashboard Editor to build and edit dashboards. The Dashboard Editor is useful if we have a collection of saved reports which we want to add to a dashboard quickly. Here's one Dashboard example. In this tutorial, we have taken the example of Buttercup games. The syntax and the procedure will be the same for all the cases, although we can change the main keyword or names as per our need. 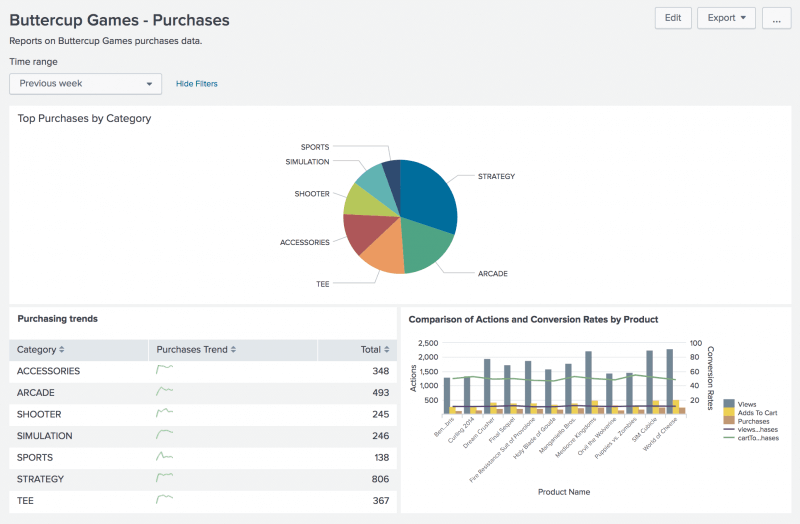
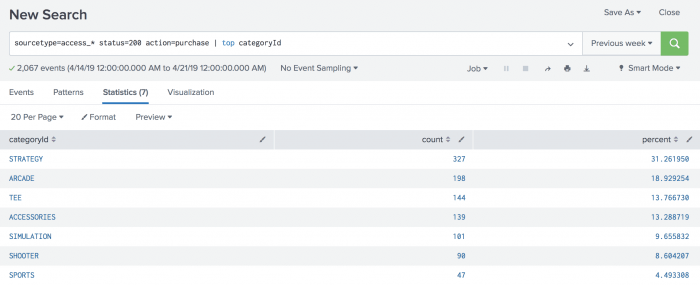
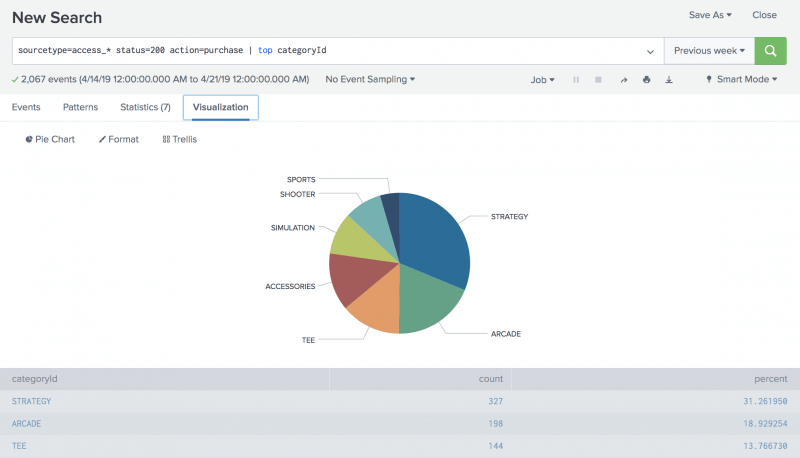
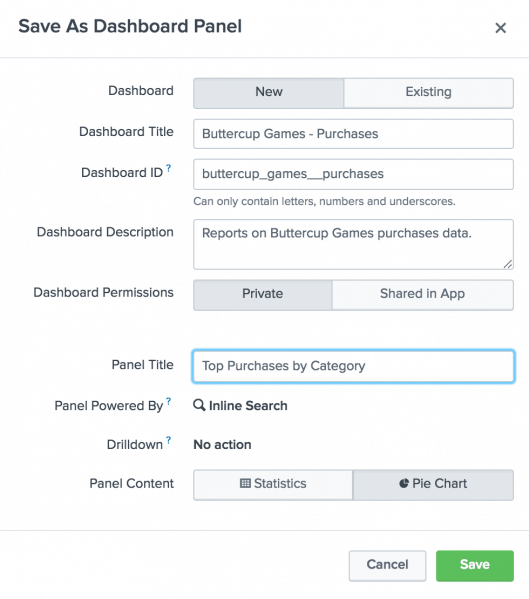
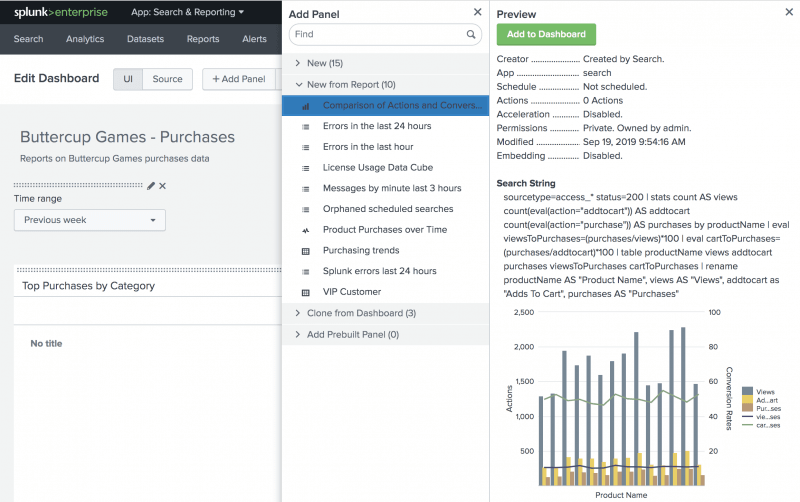
Change dashboard permissionsWe can give Dashboard Editor access to a dashboard. However, our user function and the capabilities specified for that function may restrict the type of access we can have. If our Splunk user role is admin (with the default set of capabilities), we can create private dashboards, visible in a specific app, or visible in all apps. We may also give access to other Splunk user positions with different skills, such as user, admin, and other functions. Change dashboard panel visualizationsWe are using the Visualization Editor to adjust the form of visualization in the panel after we create a panel with the Dashboard Editor, and decide how the viewing will display and behave. Create dashboards and panelsIn this section, we will save a search as a dashboard panel and add an input element to the dashboard. Save a search as a dashboard panel
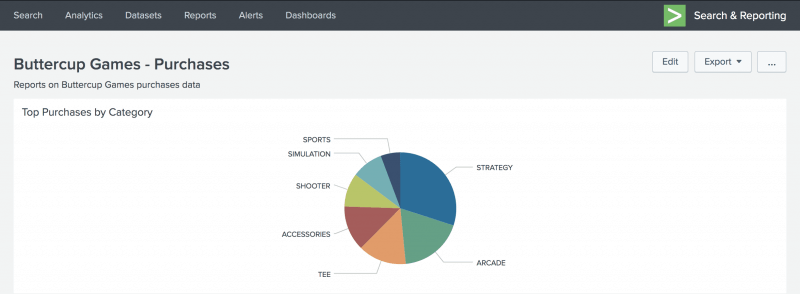
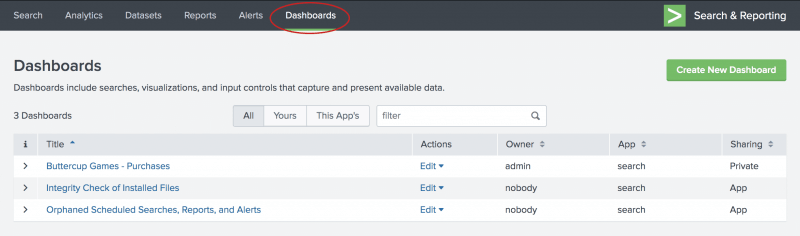
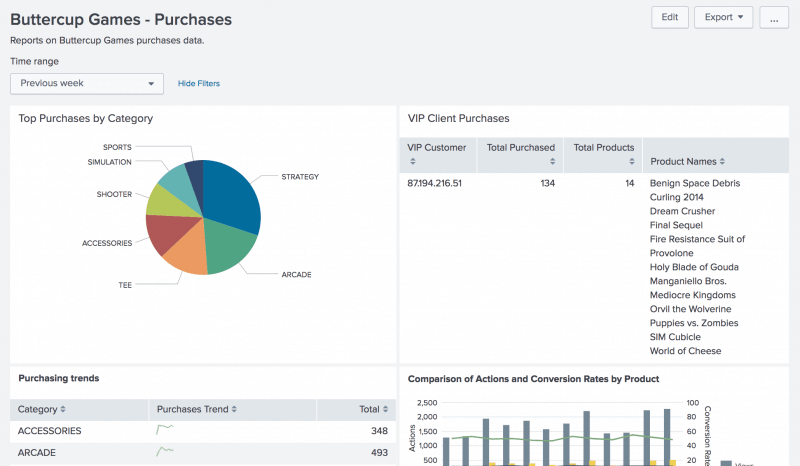
We now have a dashboard with one panel of reports. We can either run new searches and save them on this dashboard to add more report tables or add saved results to that dashboard. In the next segment, we can add more panels to the dashboard. For now, let's spend a little bit more time on this dashboard panel. View and edit dashboard panelsA separate view is given to see a list of the dashboards we have access to. We can create dashboards from this view, and make changes to the dashboards and dashboard panels. 1. Click Dashboards in the App bar to see the Dashboards view. We can see a pop-up dialog box asking if we'd like to take a Dashboard tour. When we are taking the tour, there is an opportunity to try the dashboards ourselves at the end of the ride. This alternative provides a view of the Dashboards. There are several built-in dashboards in the list, in addition to the Buttercup Games-Purchases dashboard that we made. 
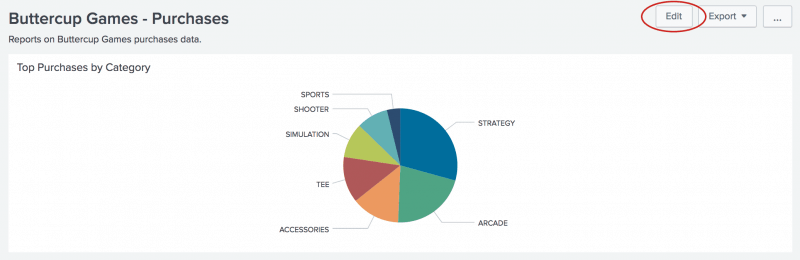
2. Click the arrow (>) icon in the I column to extend the Dashboard information for the Buttercup Games-Purchases dashboard. We can see information about the software associated with this dashboard, whether the dashboard is scheduled or not, and the dashboard permissions. 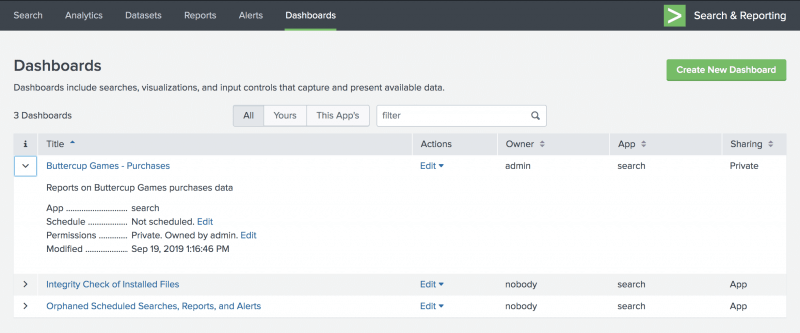
Add controls to a dashboardWe can add input controls to dashboard panels, such as the Time range picker.'
 < <
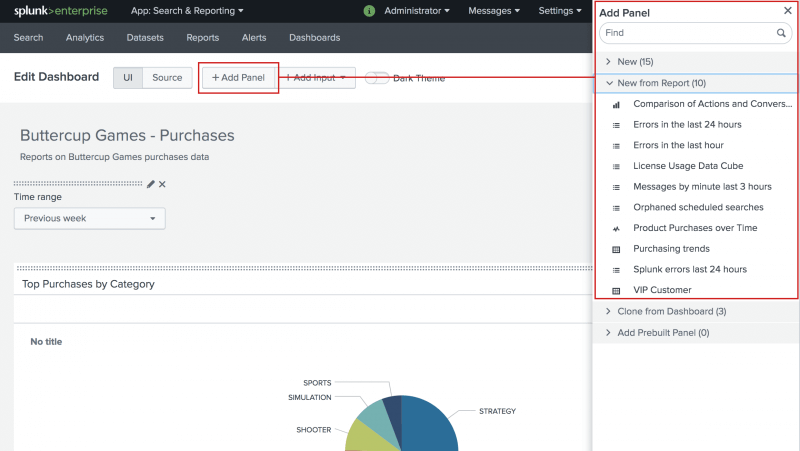
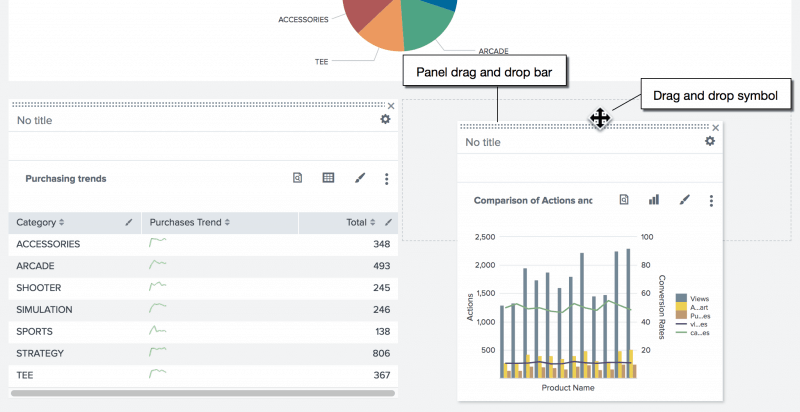
We may use either the UI or the Source to edit the Dashboard. We can then add panels and inputs to the dashboard with the UI option.
We can use the choice Dark Theme to adjust the Dashboard background appearance. We must save and refresh the dashboard to allow the theme update. We can edit the source XML for the panel directly using the Source option. Within this example, editing the source directly isn't mentioned. 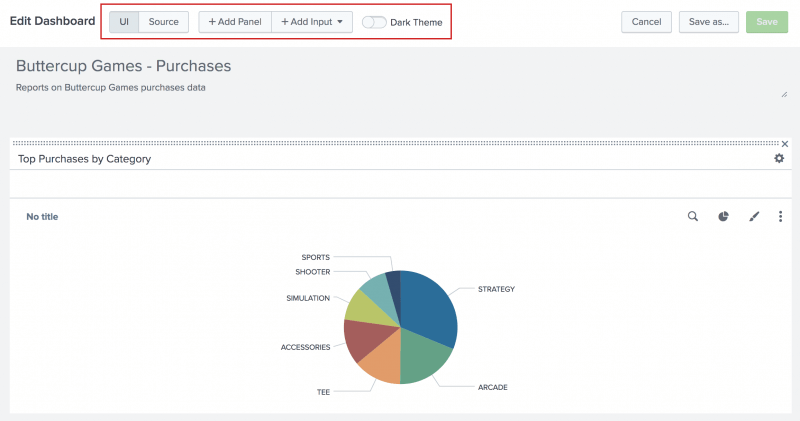
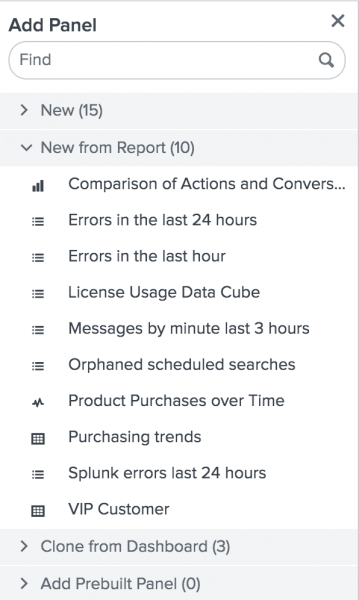
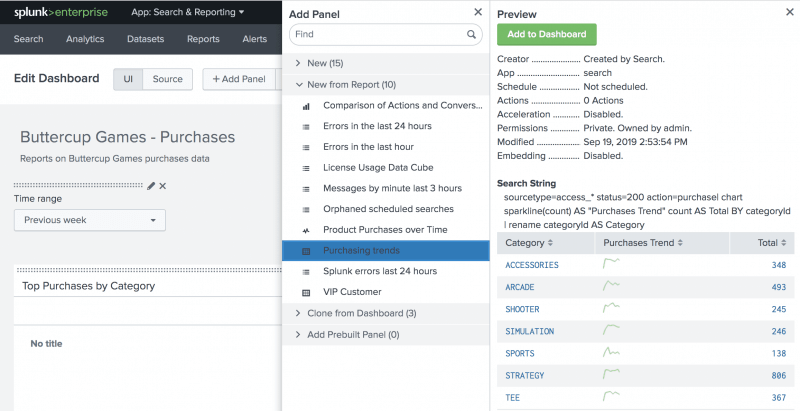
Add saved reports to a dashboardPrerequisiteMake sure we have the Games Buttercup-Buy the dashboard. This dashboard was created and modified in this tutorial 's previous segment, Creating Dashboards and Panels. Before continuing with this section, we must build the dashboard.
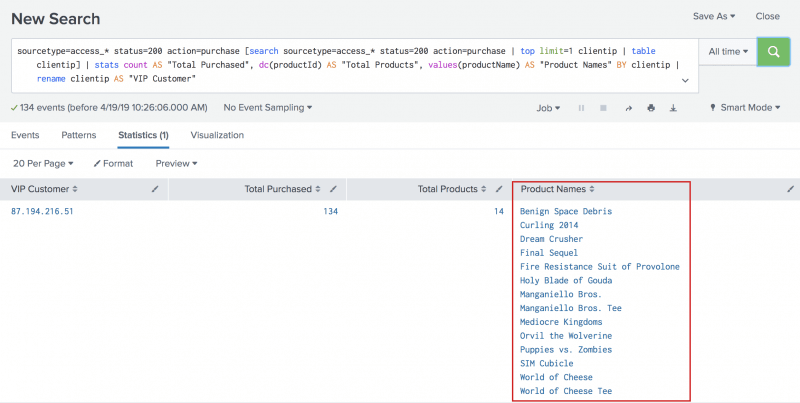
Adding a search to an existing dashboardWe can save an ad hoc search as a panel in an existing dashboard. PrerequisiteThis example includes the productName field in this tutorial 's section Allowing field lookups. Until continuing with this section, we must complete all of those steps. If we don't configure the lookups area, the searches in this section do not produce the appropriate results. Let's use the lookup to run the search below. Click Search in the Apps bar to start a new search.
Next TopicSplunk Pivot & Dataset
|

 For Videos Join Our Youtube Channel: Join Now
Feedback
- Send your Feedback to [email protected]
Help Others, Please Share


