| |

What is the difference between Trend and Forecasting in Microsoft Excel?It is well known that the respective Trend Analysis is a fundamental aspect of the data analysis, as it entails the systematic examination of the historical data for the purpose of identifying and comprehending the patterns or the trends that have emerged over time. So, by visualizing the data through methods such as line charts, analysts can easily discern consistent changes in the data. These changes may manifest as upward trends (values increasing over time), downward trends (values decreasing over time), or cyclic patterns, respectively. Trend Analysis provides invaluable insights into how a specific variable has evolved. These insights are quite essential for making informed decisions, identifying underlying factors affecting the data, and formulating strategies accordingly.
On the other hand, Forecasting in data analysis is the process of making efficient predictions about future values or outcomes by leveraging historical data as well as the trends that are identified through trend analysis. Despite this, Forecasting more often involves the application of statistical methods as well as models in order to estimate the future values or the trends for a specific variable. Microsoft Excel, for instance, provides various functions as well as tools for Forecasting, such as FORECAST.ETS function and Exponential Smoothing tools. What do we mean by the term Trends in Microsoft Excel?In Microsoft Excel, a Trend typically refers to a data series that primarily depicts the pattern or the tendency over some time as well. It is more often associated with the use of historical data points in order to identify and visualize how a particular variable changes or evolves. Despite this, we can also create trend lines as well as charts to represent these trends visually.
Trends in Excel are essential for data analysis, as they allow you to understand the historical behavior of your data, make informed decisions, and, in some cases, use this information for forecasting future values or outcomes. Syntax: The syntax for the use of the Trend Formula in Microsoft Excel is as follows: 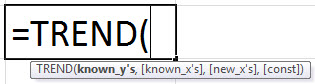
Arguments: The linear equation y = mx + c basically represents a relationship that exists between the two variables, where 'y' depends on 'x' with a constant term 'c' and a slope 'm.' When working with this equation and data, we have several parameters or arguments to consider, which are discussed below:
So, these particular parameters give us the flexibility to analyze as well as to predict values by just making use of the linear equation while allowing us to consider or disregard the constant term 'c' based on our specific analysis needs. What are the key features associated with the use of Trends in Microsoft Excel?The various important key features which are associated with the use of Trends in Microsoft Excel are as follows:
These features can be valuable for data analysis, trend identification, as well as for Forecasting within Excel, making it a versatile tool for working with data effectively. What are the important steps of the TREND Function in Microsoft Excel?We can easily find the TREND Function under the Statistical function here; now we are moving ahead to see the step-by-step procedure on how to use it in Microsoft Excel: Step 1: First of all, we are required to choose the insert function, and by doing this, we will get the dialogue box, as depicted below. 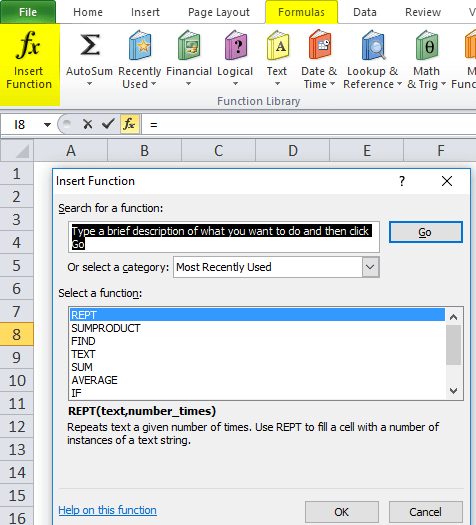
Step 2: Now, just after that, we are required to select the category statistically; once we choose the category, we will be encountered with a list of the functions displayed as shown below screenshot, respectively 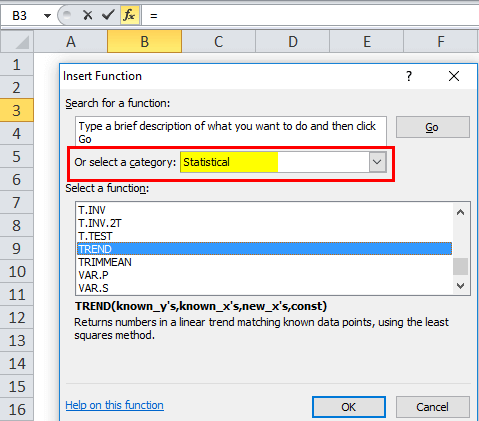
Step 3: Now, in this step, we are effectively required to select the TREND function. 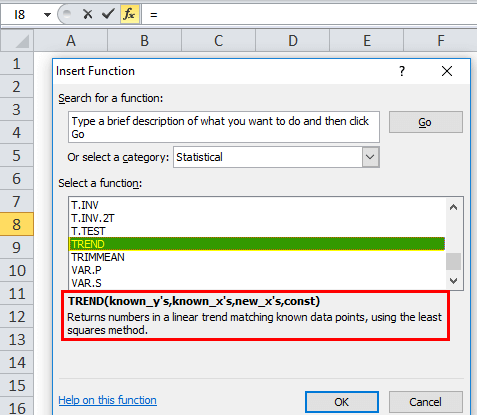
Step 4: In the advanced version, we will have a shortcut in the formula bar that is known as the more function and follow the below procedure. First, we need to go to formulas->then after choose More Function->Statistical->TREND respectively. 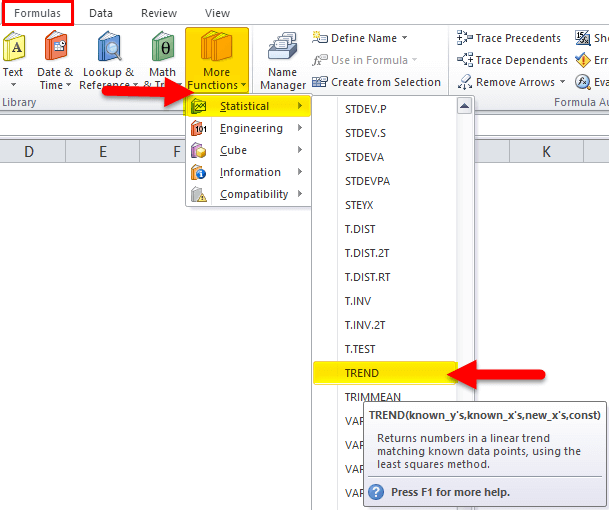
How do you make use of the TREND function in Microsoft Excel?It was well known that the respective TREND Function in Microsoft Excel is very simple and easy to use. Let us now understand the working of the TREND in Excel with Some Examples as well. # Example 1 Now, in this particular example, we have been addressed with month-wise sales data from Jan-18 to Sep-18, where we need to find out the next Month's sales by just making use of the TREND Function in Microsoft Excel. 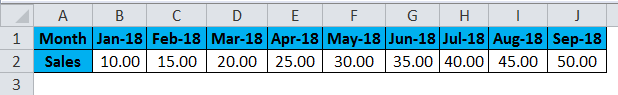
Now, use the TREND Formula below as well. 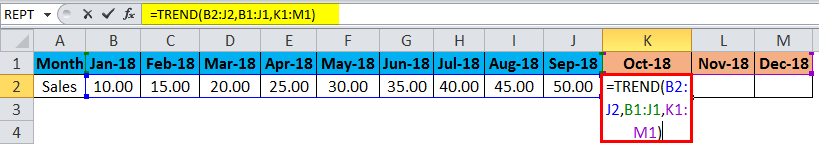
So, here, the respective Trend function with the next month's sales has been calculated and depicted below respectively. 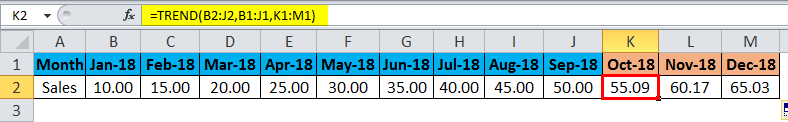
So, in this example, we have predicted the upcoming sales value for the next three months as well. #Example 2 Let us now see another example with a graphical chart format by just making use of the multiple values. In this, the below example basically depicts the monthly sales data where there are ups and downs in the sales value, respectively. If we want to produce this format, we cannot view the sales data easily; hence, we can show the sales data in reference to the trend function in chart format so that we will be given the appropriate output effectively. In this example, the B40 cell primarily represents the Month, and the C40 cell represents the actual sales, whereas the D40 represents the Trend values in the sales data respectively. 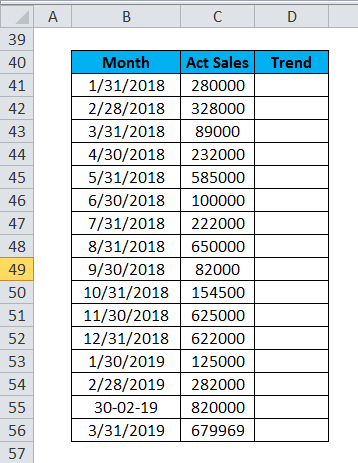
Now, we are going to make use of the trend function here to get the desired output, so for this, we need to select the column that is none other than D41 to D56 and make use of the trend function as per below. 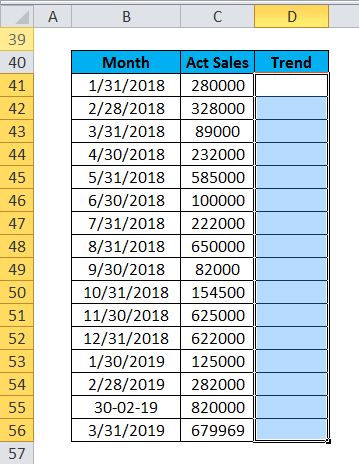
Now, just after selection, we need to make use of the Trend function by selecting the C41: C56 column, and then we have to make use of the CTRL+SHIFT ENTER from our keyboard to get the entire trend value as depicted below. 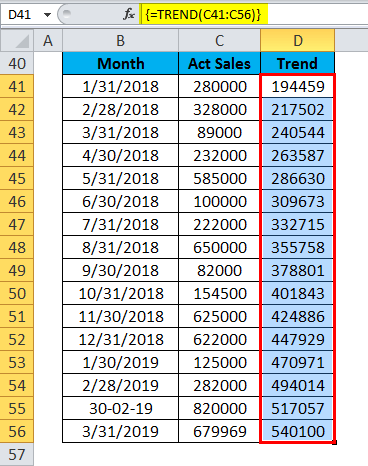
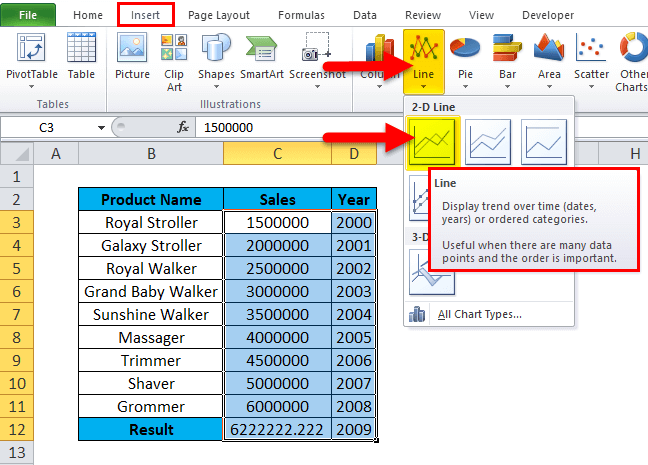
And now, if in case we want to view in the graphical chart format, choose insert and select the line chart format, respectively. 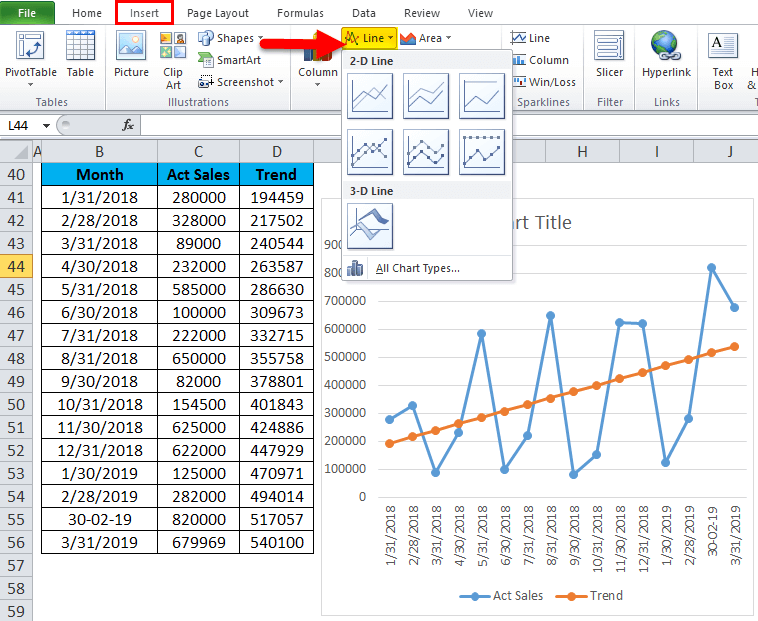
So after performing the above step, we will encounter the line chart graph as given below, which shows very clearly sales data month-wise. 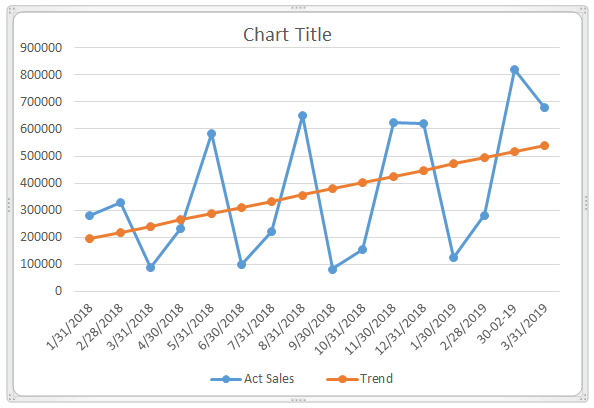
Now, this sales data shows only the trend figure with the orange line depicting the linear values, and the graph will be more dynamic if we put the month-wise growth value as well. Use the growth function as explained above by using CTRL+SHIFT+ENTER from our keyboard; we will get a growth value figure with another line chart, which is efficiently depicted below in grey color. 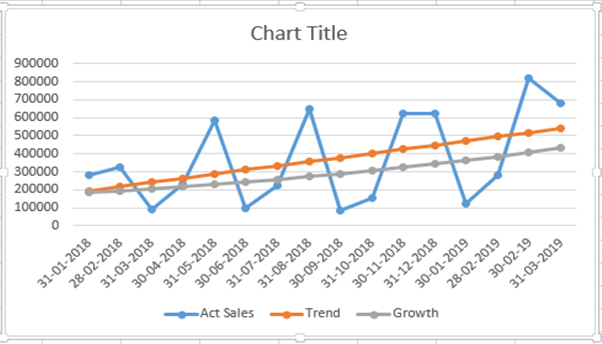
In the sales and financial accounting scenarios, these charts are helpful in predicting the company's production and growth. What is meant by the term forecasting in Microsoft Excel?Forecasting in Microsoft Excel mainly involves the systematic use of historical data in order to predict future values or trends, and more often, it primarily begins with the collection of past data, which could pertain to anything from sales figures to weather conditions. Microsoft Excel offers various tools as well as functions to analyze this data, including the creation of charts, pivot tables, and calculating descriptive statistics. These tools help in identifying the patterns, trends, and relationships within the data. Once the historical data is thoroughly understood, Excel basically provides several methods for Forecasting. These methods include moving averages, exponential smoothing, and regression analysis. Moreover, the moving averages help to smooth out the fluctuations and to identify the trends efficiently. At the same time, exponential smoothing assigns more weight to recent data, making it particularly useful for short-term Forecasting. Despite this, the respective regression analysis can uncover the relationships that primarily exist between the variables and make predictions based on those relationships. After choosing an appropriate method, we can easily create forecasts by just making use of Excel's built-in functions as well as the features. It is important to understand and adjust any parameters specific to the chosen forecasting method, such as the number of periods to forecast or smoothing factors. In addition to this, Microsoft Excel can easily provide measures like confidence intervals as well as standard errors to assess the reliability of our forecasts effectively. The generated forecasts can then be interpreted and used for decision-making in various contexts, such as inventory management, financial planning, or resource allocation. Microsoft Excel's forecasting capabilities are valuable for making informed, data-driven decisions based on historical data as well as predictive models. Syntax: The syntax which has been used for the Forecasting in Microsoft Excel is as follows: 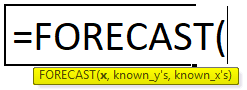
Arguments of FORECAST Function in Microsoft Excel:
Features of Forecasting:
It was well known that the respective forecast function will come under the category of a Statistical function here; we will see a step-by-step procedure on how to make use of it. We are required to go to the formula menu, and then after that, we need to click on the insert function, and a dialogue box will be displayed. Choose the category statistically. Once we choose the statistical, we will then find a list of a function, and then we need to choose the forecast function respectively. 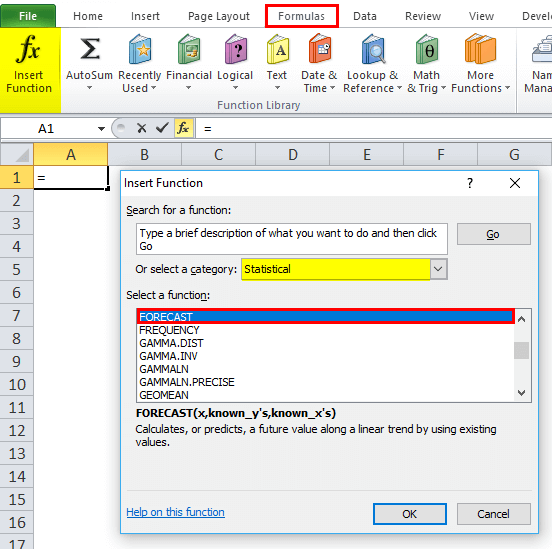
More often in the advanced version, we can make use of the shortcut, wherein we can see more functions in the formula menu as well. Go to formulas->Choose More Function->Statistical->Forecast. What are the key features associated with the use of Forecast in Microsoft Excel?The various important key features which are associated with the use of Forecast in Microsoft Excel are as follows:
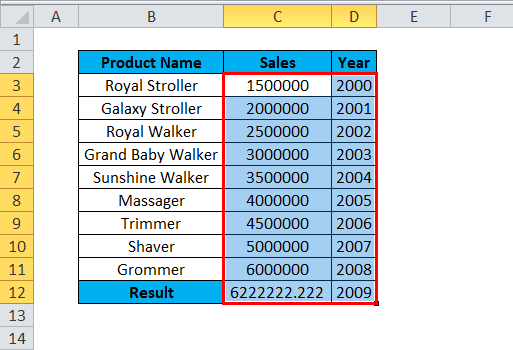
Overall, Forecasting is a crucial tool for different organizations and also for individuals to make informed decisions and plan for the future based upon a systematic analysis of the data and trends, respectively. How to make use of the FORECAST Function in Microsoft Excel?The respective FORECAST Function in Microsoft Excel is basically termed to be a very simple-to-use function. Let us now see how to make use of the FORECAST function in Microsoft Excel with the help of some examples as well for a better understanding. # Example 1 In this particular example, we will be making use of the FORECAST function for the purpose of predicting the next Month's sales data, so let us now assume that a popular company, FMCG, has monthly sales data, and despite this, the management primarily needs to find out the sales forecasting in order to get the next Month's sales. In this scenario, the forecasting function will be very useful in pointing out future sales effectively. Now, in the below example, we can see that the year-wise sales data has given great revenue; now, we will be making use of the forecast function for the purpose of predicting how the sales will be there for the year 2009. 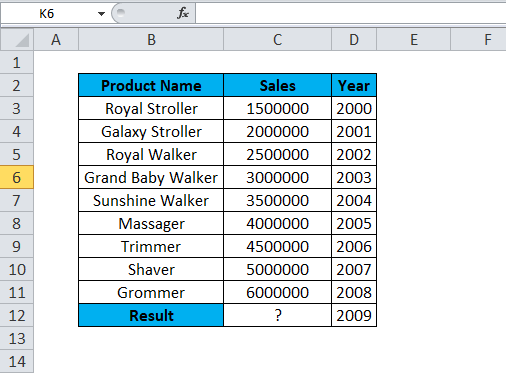
Now, in the above sales data, we can see that the product sales item has earned revenue-wise. And to effectively predict the next year's data, we can make use of the FORECAST function. More often, for the year 2008, the Product Name "Grommer" earned a sales value of 6000000, and to efficiently predict the next year, i.e., 2009 Sales value, we can make use of the FORECAST in Microsoft Excel sheet as depicted in the sales data. 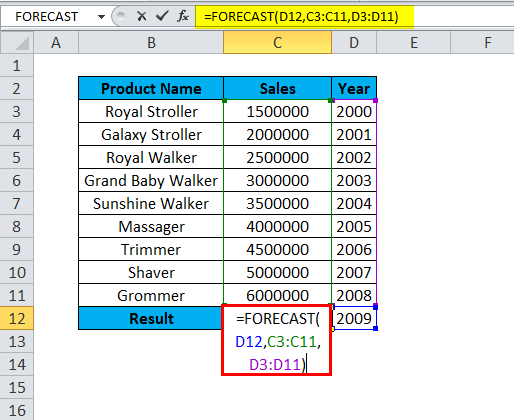
So to achieve this, we need to make use of the FORECAST function in Microsoft Excel to derive the next year's sales value in which:
Result: 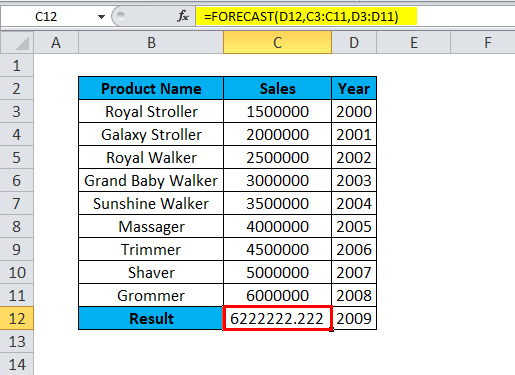
However, the Sales revenue for the Groomer Product for the Year 2009 is 6222222. So, we can easily predict the sales revenue for a given product as well. Let us now see the above sales data in the dynamic graph format so that it can be viewed easily to understand; for the purpose of displaying the above sales data in the graphical chart format, we need to follow the below steps:
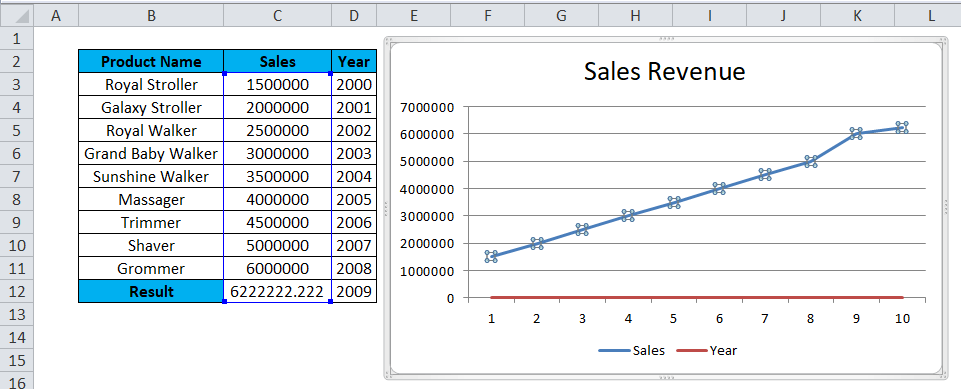
Result: The below sales data of the line chart clearly shows that for the year 2009, we have more revenue where the blue line goes up, indicating the exact prediction of 6222222. 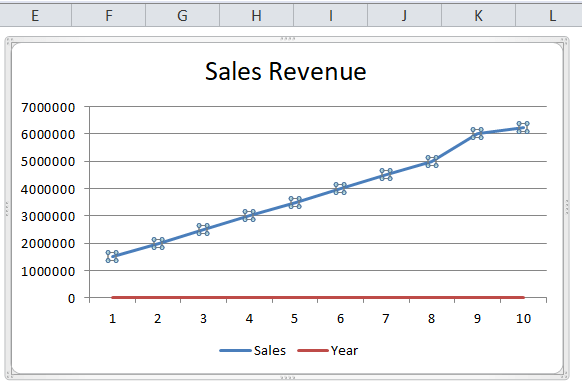
What is the key difference between Trends and Forecast in Microsoft Excel?The key difference that lies between trends and forecasts in Microsoft Excel is their purpose and the methods used: Trends:
Forecasts:
In summary, trends deal with the historical data analysis as well as the visualization, while forecasts make use of that historical data to make predictions about the future values. Both are valuable in different aspects of the data analysis and decision-making.
Next TopicData Scrapping In Microsoft Excel
|
 For Videos Join Our Youtube Channel: Join Now
Feedback
- Send your Feedback to [email protected]
Help Others, Please Share


