Pandas DataFrame.hist()
The hist() function is defined as a quick way to understand the distribution of certain numerical variables from the dataset. It divides the values within a numerical variable into "bins". It counts the number of examinations that fall into each of the bin. These bins are responsible for a rapid and intuitive sense of the distribution of the values within a variable by visualizing bins.
We can create a histogram by using the DataFrame.hist() method, which is a wrapper for the matplotlib pyplot API.
It is also a useful tool that quickly access the probability distribution.
Syntax
Parameters
- data: A DataFrame.
It is a pandas DataFrame object that holds the data.
- column: Refers to a string or sequence.
If it is passed, it will be used to limit the data to a subset of columns.
- by: It is an optional parameter. If it is passed, then it will be used to form the histogram for independent groups.
- grid: It is also an optional parameter. Used for showing the axis grid lines. Default value True.
- xlabelsize: Refers to the integer value. Default value None. Used for specifying the changes in the x-axis label size.
- xrot: Refers to float value. Used for rotating the x-axis labels. Default value None.
- ylabelsize: Refers to an integer value. Used for specifying the changes in the y-axis label size.
- yrot: Refers to the float value. Used for rotating the y-axis labels. Default value None.
- ax: Matplotlib axes object.
It defines the axis on which we need to plot the histogram. Default value None.
- sharex: Refers to the boolean value. Default value True, if ax is None else False. In the case of subplots, if value is True, it shares the x-axis and sets some of the x-axis labels to invisible. Its Default value is True.
If the ax is none, it returns False if an ax is passed in.
Note: Passing true in both an ax and sharex, it will alter all x-axis labels for all the subplots.
- sharey: Default value False. In the case of subplots is True, it shares the y-axis and sets some y-axis labels to invisible.
- figsize: Refers to the size in inches for the figure to create. By default, it uses the value in matplotlib.rcParams.
- layout: It is an optional parameter. It returns the tuple of (rows, columns) for the layout of the histograms.
- bins: Default value 10. It refers to the number of histogram bins that are to be used. If an integer value is given, then it returns the calculated value of bins +1 bin edges.
- **kwds: Refers to all the other plotting keyword arguments that are to be passed to matplotlib.pyplot.hist().
Returns
It returns the matplotlib.AxesSubplot or numpy.ndarray.
Example1
Output
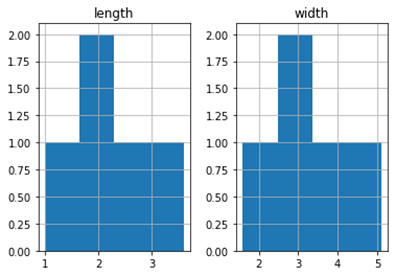
|

 For Videos Join Our Youtube Channel: Join Now


