| |

Pandas PlotIt is used to make plots of DataFrame using matplotlib / pylab. Every plot kind has a corresponding method on the DataFrame.plot accessor: df.plot(kind='line') that are generally equivalent to the df.plot.line(). Syntax:Parameters:data: DataFrame x: Refers to label or position, default value None y: Refers to label, position or list of label, positions, default value None It allows the plotting of one column versus another. kind: str
ax: matplotlib axes object, default None subplots: boolean, default False Make separate subplots for each column sharex: It returns the boolean value and default value True if the ax is None else returns False. If the subplots =True, it shares the x-axis and set some x-axis labels to the invisible; Its default value is True if ax is None; otherwise, if an ax is passed, it returns false. If you pass True on both an ax and shareax, it will alter all the x-axis labels. sharey: It also returns a boolean value that default value False. If the subplots= True, it shares the y-axis and set some y-axis to the labels to invisible. layout: It is an optional parameter that refers to the tuple for the layout of subplots. figsize: Refers to a tuple (width, height) in inches. use_index: It returns the boolean value; default value True. It uses the index as ticks for the x-axis. title: Refers to a string or list that defines a title for the plot. If we pass a string, it will print string at the top of the figure. If we pass a list and subplots as True, it will print each item in the list in the corresponding subplot. grid: Returns the boolean value, the default value is None. It defines the axis grid lines. legend: Returns the False/True/'reverse' and place the legend on axis subplots. style: Returns the list or dict. It defines the matplotlib line style per column. logx: Returns the boolean value; the default value is False. It generally uses a log scale on the x-axis. logy: Returns the boolean value; the default value is False. It generally uses log scaling on the y-axis. loglog: Returns the boolean value; the default value is False. It uses log scaling on both x and y axes xticks: Refers to a sequence that consists of values to use for the xticks. yticks: Refers to a sequence that consists of values to use for the yticks. xlim: It consists 2-tuple/list. ylim: It consists 2-tuple/list rot: Refers to an integer value; the default value None It generally Rotates for ticks (xticks for vertical, yticks for horizontal plots) fontsize: Refers to an integer value; the default value is None. Its main task is to specify the font size for xticks and yticks. colormap: Refers to str or matplotlib colormap object, default value is None. It provides colormap to select colors. If a value is a string, it loads colormap with that name from matplotlib. colorbar: It is an optional parameter that returns a boolean value. If the value is True, it plots the colorbar (only relevant for 'scatter' and 'hexbin' plots) position: Refers to float value. Its main task is to specify the relative alignments for the bar plot layout. Its value ranges from 0 (left/bottom-end) to 1 (right/top-end). The default value is 0.5 (center). table: Returns the boolean value, Series or DataFrame, default value False If the value is True, it draws a table using the data in the DataFrame. If we pass a Series or DataFrame, it will pass data to draw a table. yerr: Refers to the DataFrame, Series, array-like, dict, and str. xerr: It is the same type as yerr. stacked: Returns the boolean value; the default value is False in line and bar plots, and True in area plot. If the value is True, it creates a stacked plot. sort_columns: Returns the boolean value; the default value is False It sorts column names to determine plot ordering secondary_y: Returns the boolean value or sequence; the default value is False. It checks whether to plot on the secondary y-axis. If a list/tuple, it plots the columns of list /tuple on the secondary y-axis mark_right: Returns the boolean value; the default value is True. It is used when using a secondary_y axis, automatically mark the column labels with "(right)" in the legend '**kwds': It is an optional parameter that refers to the options to pass to the matplotlib plotting method. Example:Output: 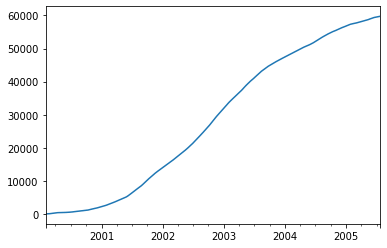
Next TopicPandas Interview Questions
|
 For Videos Join Our Youtube Channel: Join Now
Feedback
- Send your Feedback to [email protected]
Help Others, Please Share


