| |

Output of Chi-square test in SPSSTo calculate the Chi-square test, we will recall the last option. We will go to the Crosstab option like this: 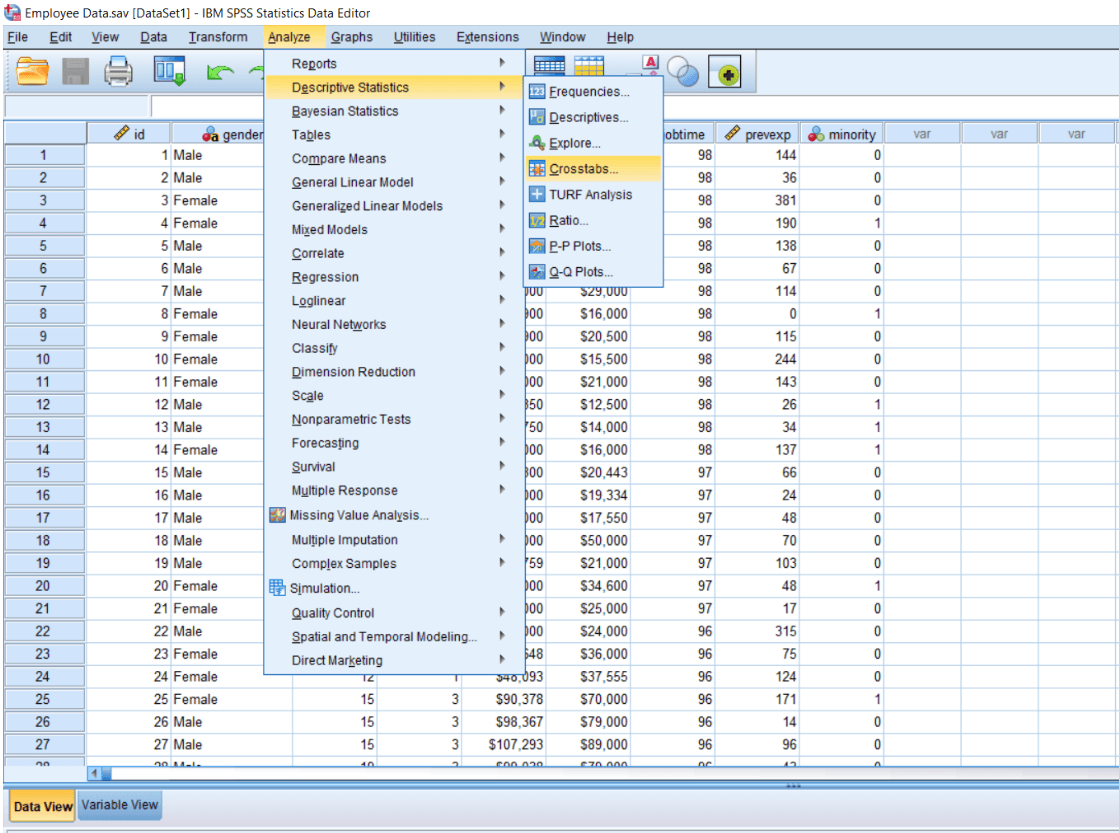
After clicking on the crosstab option, we will see the following window. 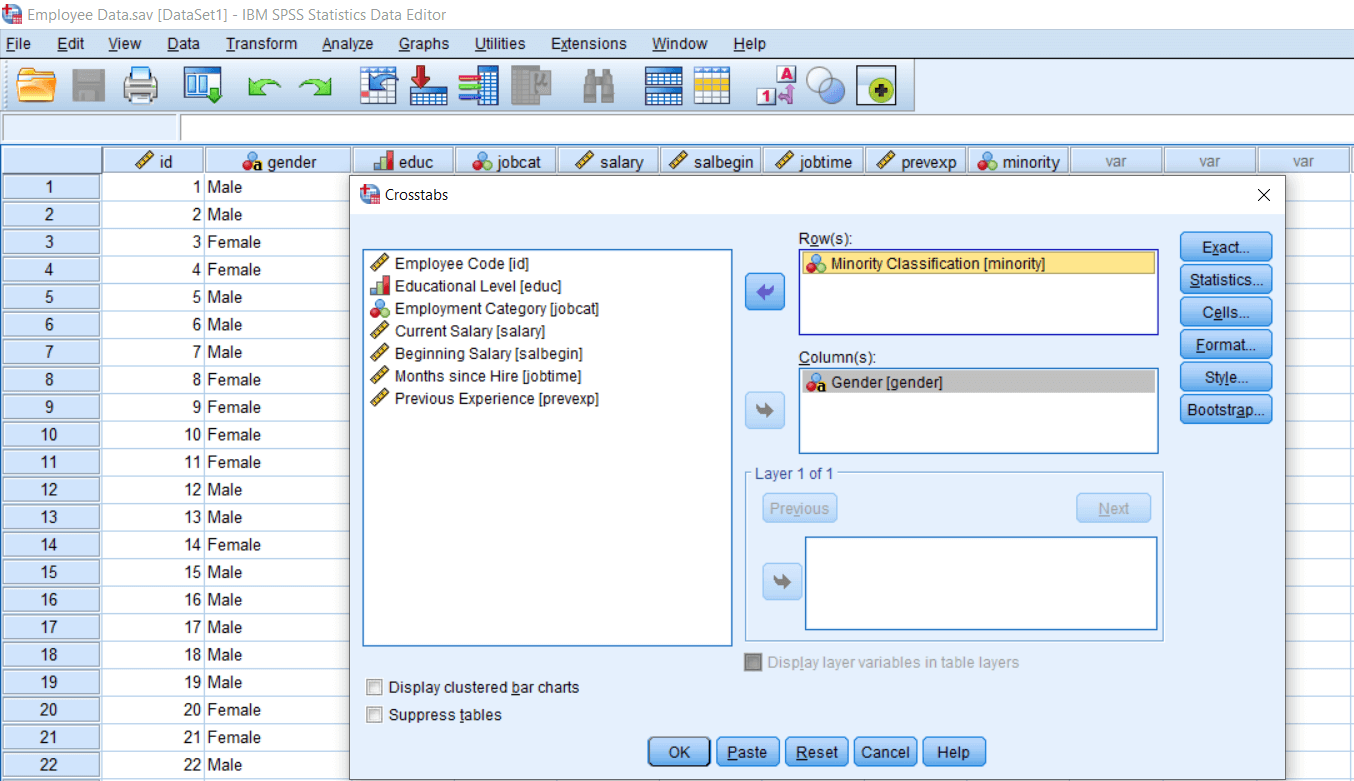
Now the extra thing we are going to do is select the Statistics option and check the Chi-square box and then click on Continue and then press Ok like this: 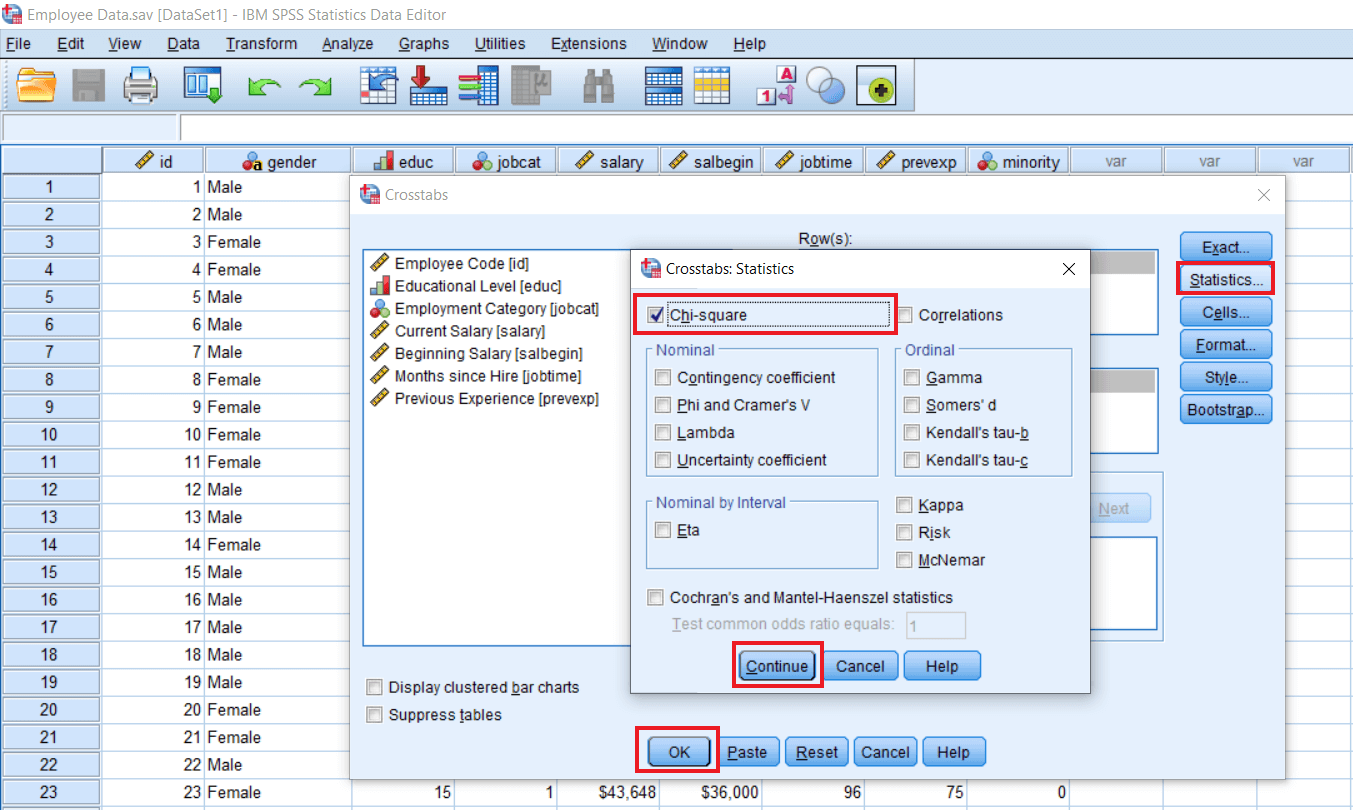
After this, we will get the following output where we have the Old table that we already show. The additional table we are getting is a Chi-square test table like this: 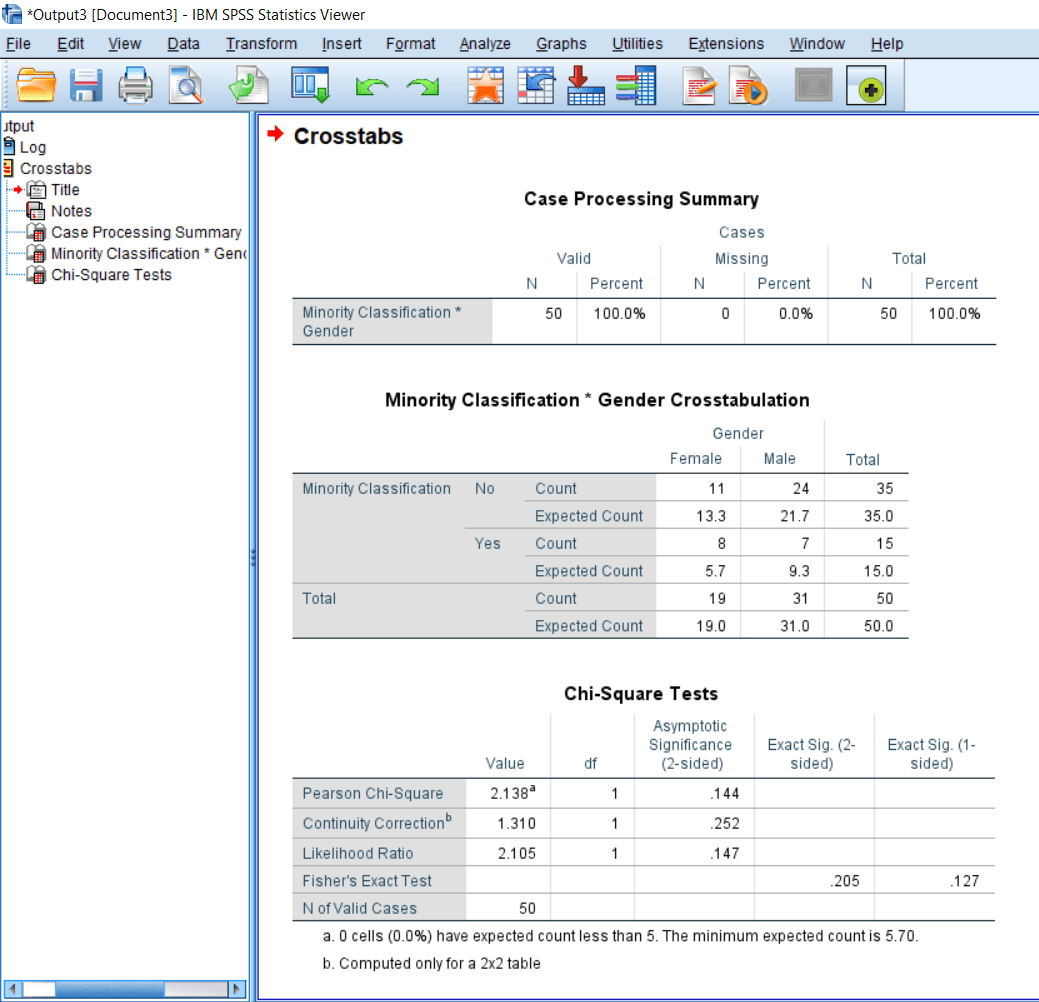
In the Chi-square test table, we can see the Person chi-square value is 2.138a, where a shows a message that 0 cells (0.0%) have expected cell count less than 5. The minimum expected cell count is 5.70. So it means our assumptions are met, and it is not being violated. So the chi-square value is 2.138, and the degree of freedom is 1. In a chi-square test, the degree of freedom is calculated by a formula which is as follows:
df= (r-1) * (c-1)
Where r = Number of rows c = number of columns In the minority classification table, we have two columns: male and female and two rows with minority classification no and minority classification yes. So the degree of freedom will be (2-1) * (2-1), i.e., 1. That's why we got a degree of freedom as 1. 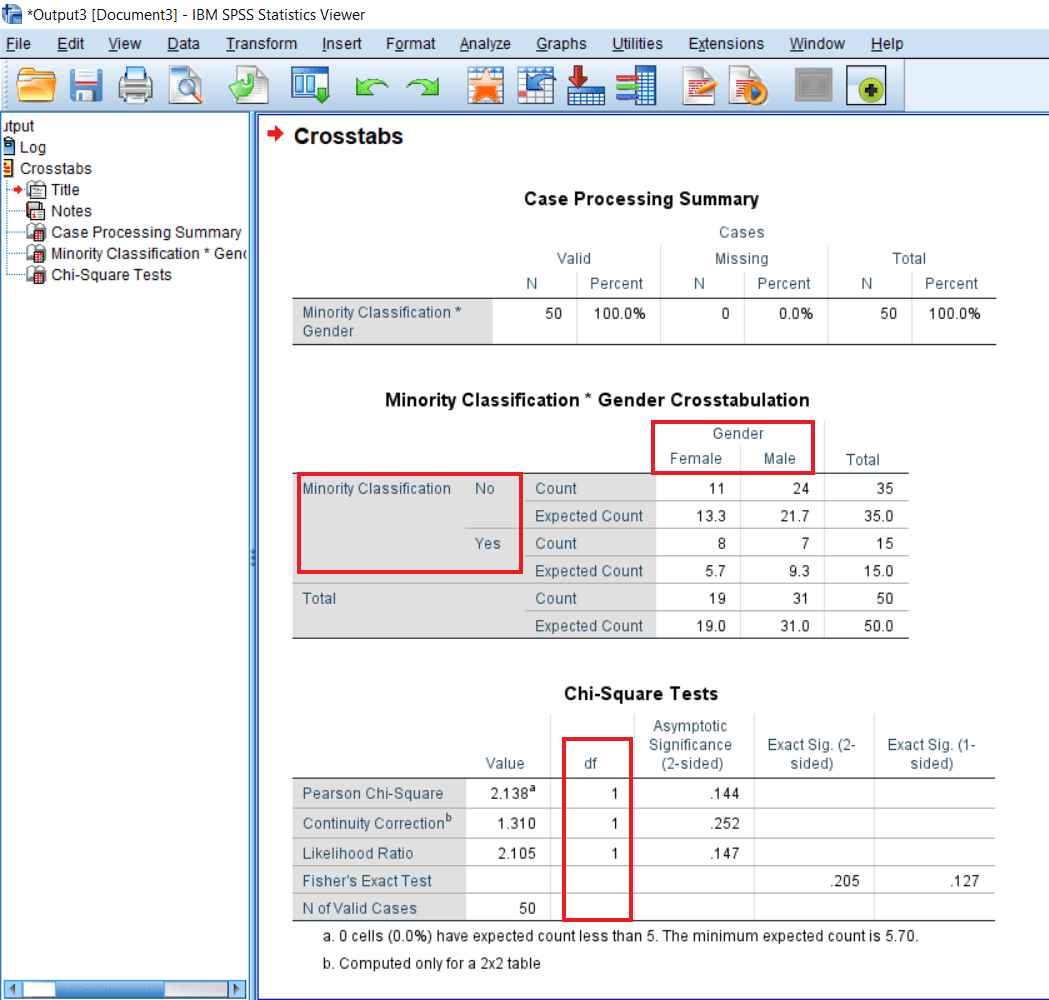
Now the significance value is .144. Since this value is more than .05, so in that case, we accept the null hypnosis. Null hypnosis says that there is no significant difference between the number of males and females belonging to the minority Vs. Non-minority category. So the distribution of males and females are the same for minority as well as non-minority category. If we look at the number in the Minority classification table, the numbers are quite different from each other. We have 11 females and 24 males in the no category and 13.3 females and 21.7 males in the yes category. But at the significance level, there is no statistical significance as such. 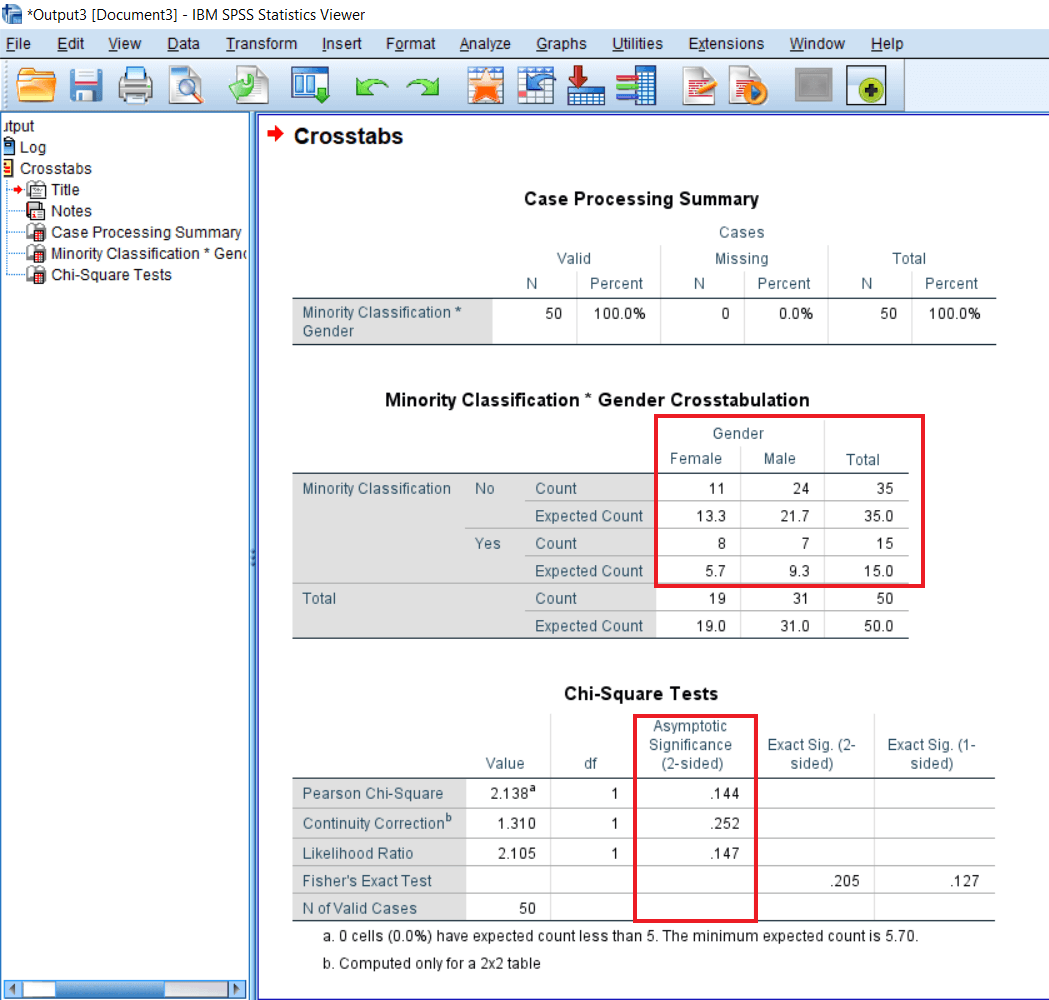
Next TopicReliability analysis
|
 For Videos Join Our Youtube Channel: Join Now
Feedback
- Send your Feedback to [email protected]
Help Others, Please Share


