| |

TensorBoardTensorFlow is a visualization tool, which is called the TensorBoard. It is used for analyzing the Data flow graph and used to understand machine-learning models. TensorBoard is the interface used to visualize the graph and many tools to understand, debug, and optimize the model. The important feature of TensorBoard is that it includes a view of different types of statistics about the parameters and details of any graph in a vertical alignment. The deep neural network includes up to 36,000 nodes. TensorFlow helps in collapsing these nodes in high in collapsing these nodes in high-level blocks and highlighting the identical structures. This allows better analysis of the graph, focusing on the primary sections of the computation graph. 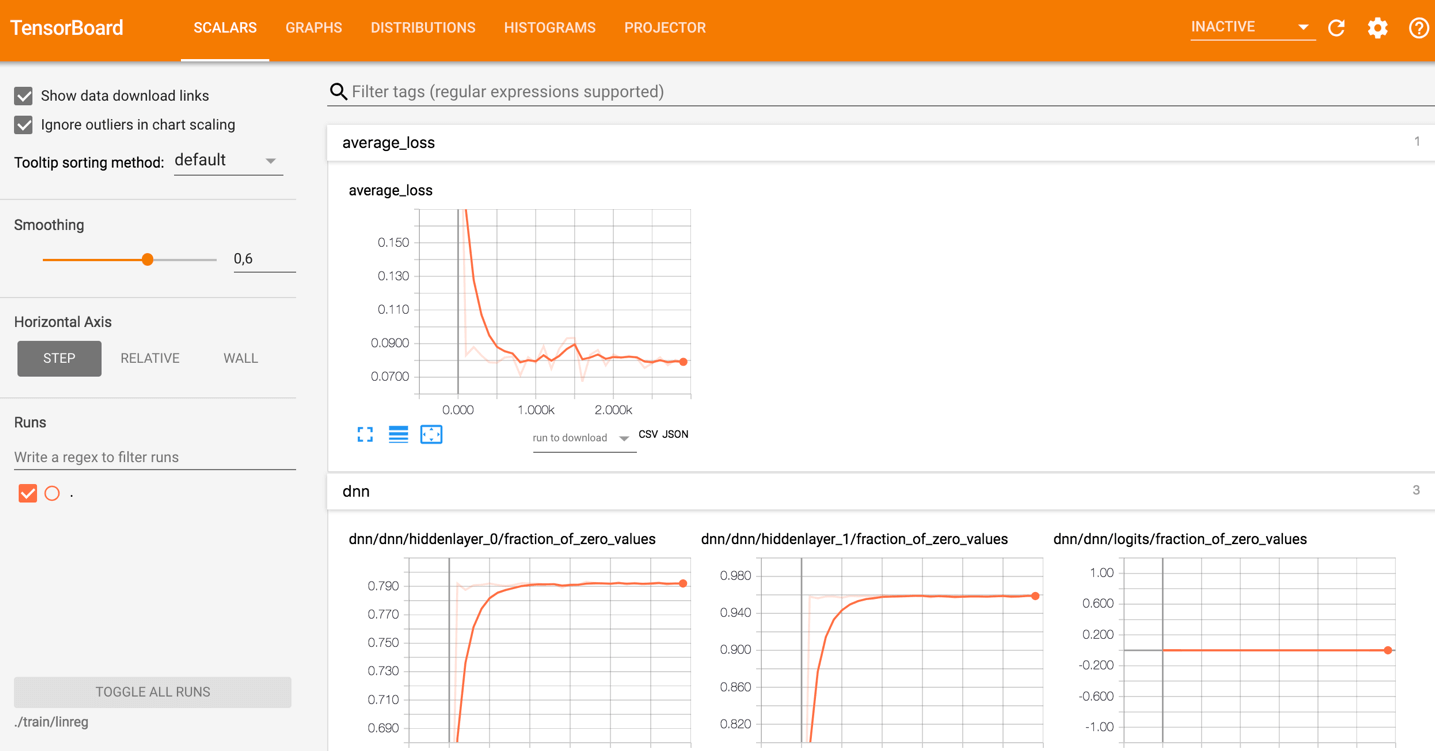
The TensorBoard visualization is said to be very interactive where a user can pan, zoom, and expand the nodes to display the details. The following are the given diagram representation shows the complete working of TensorBoard visualization- 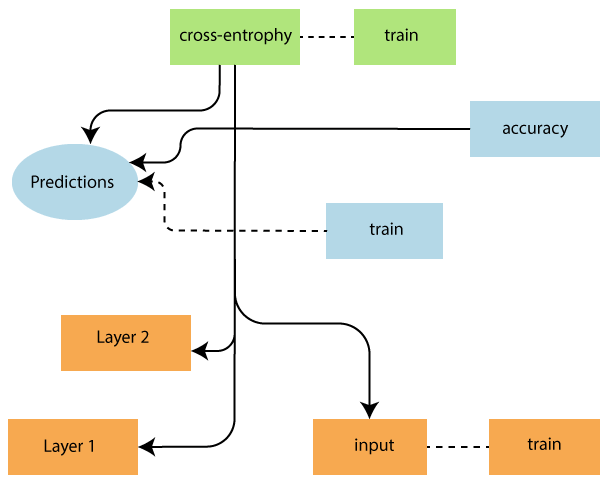
The algorithms collapse the nodes into high-level blocks and highlighted the specific groups with identical structures, which separating the high-degree nodes. The TensorBoard created is useful and is treated equally important for tuning a machine learning model. This visualization tool is designed for the configuration log file. Look at the picture below: 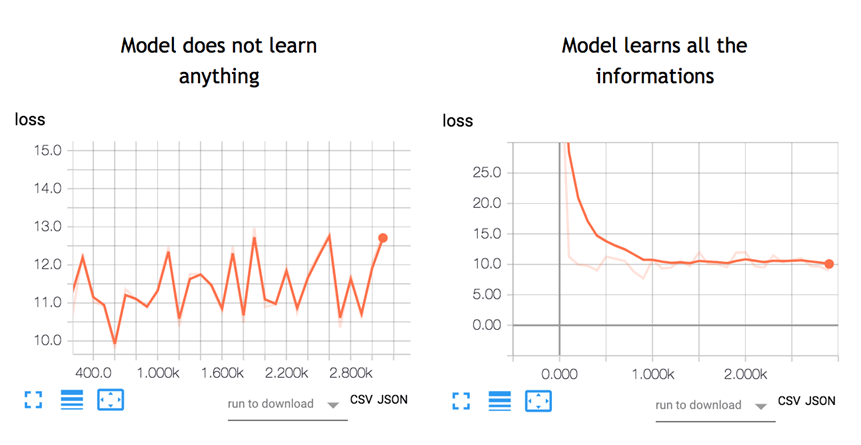
A neural network decides how to connect the different "neurons" and how many layers before the model can predict the outcome. Once we have defined the architecture, we not only need to train the model but also metrics to compute the accuracy of the prediction. This metric is referred as a loss function. The objective is to as a loss function. TensorBoard is a great tool to visualize metrics and highlighted the potential issues. The neural network can take hours to weeks before they find a solution. TensorBoard updates the parameters very often. TensorBoard is located in this URL: http://localhost:6006 Types of DashBoard in TensorBoard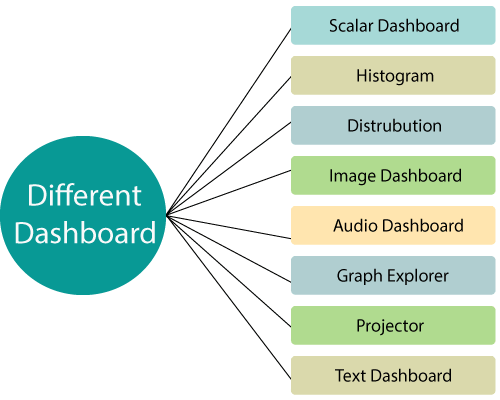
1. Scalar Dashboard It is used to visualize time-dependent stats; for example, we might want to look at the variations in learning rate or the loss function. 2. Histogram Histogram Dashboard in TensorBoard displays how the statistical distribution of a Tensor has varied over time. It visualizes data recorded via tf.summary.histogram. 3. Distribution Dashboard It shows some high-level use of tf.summary.histogram. It shows some high-level starts on a distribution. Each line on the chart gives a hint about the percentile in the distribution over the data. 4. Image Dashboard This shows the png that was saved via a tf.summary.image. Rows correspond to the labels and the columns to the run. By using this image dashboard of TensorBoard, we can embed custom visualizations. 5. Audio Dashboard It is an excellent tool for embedding playable audio widgets for audios saved via a tf.summary.audio. The dashboard always embedding the latest audio for every tag. 6. Graph Explorer It primarily used for enabling inspection of the TensorFlow model. 7. Projector The embedding projector in TensorFlow used for multi-dimensional data. The embedding projector reads data from the checkpoint file and might be set up with corresponding data, such as a vocabulary file. 8. Text Dashboard Text Dashboard shows text experts saved via tf.summary.text., includes features like hyperlinks, lists, and tables, are all supported. 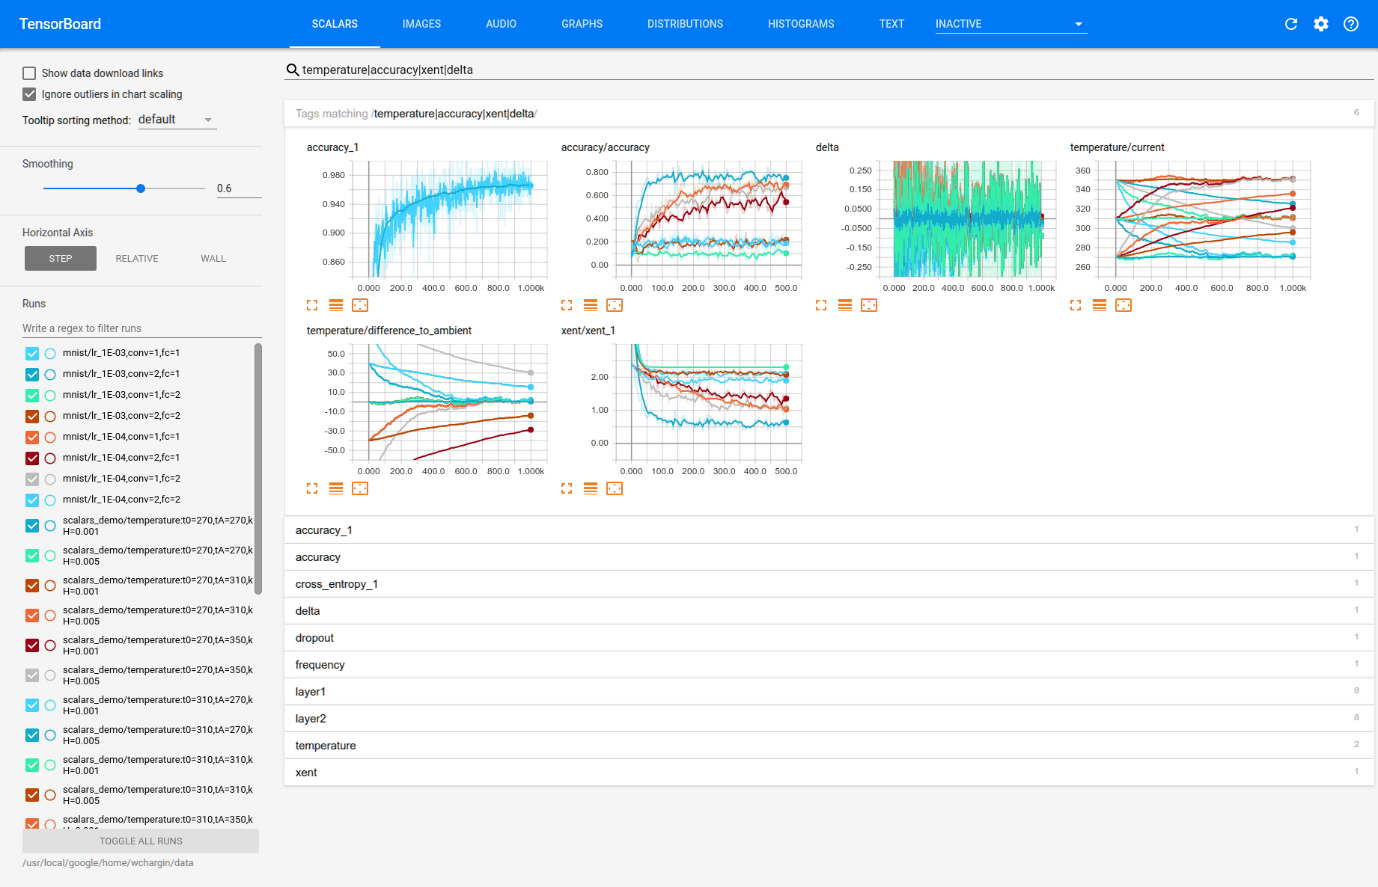
Different Views of TensorBoardDifferent views take inputs of different formats and display them differently. We can change them on the orange top bar.
How to use TensorBoard?We will learn how to open TensorBoard from the terminal for MacOS and Command-line Windows. The code will be explained in a future tutorial; the focus here is on TensorBoard. First, we need to import the libraries we will use during the training. We create the data. It is an array of 10000 rows and columns/p> The below code transform the data and create the model. Note that the learning rate is equal to 0.1. If we change this rate to a higher value, the model will not find a solution. This is what happened on the left side of the above picture. In the example below, we store the model inside the working directory, i.e., where we store the notebook or python file. Inside the path, TensorFlow create a folder called train with a child folder name linreg. Output:
INFO:tensorflow:Using the default configuration.
INFO:tensorflow:Using config:{'_model_dir': 'train/linreg', '_tf_random_seed': None, '_save_summary_steps': 100, '_save_checkpoints_steps': None, '_save_checkpoints_secs': 600, '_session_config': None, '_keep_checkpoint_max': 5, '_keep_checkpoint_every_n_hours': 10000, '_log_step_count_steps': 100, '_train_distribute': None, '_service': None, '_cluster_spec': The last step consists to train the model. During the training period, TensorFlow writes information in the model directory. Output: INFO:tensorflow:Calling model_fn. INFO:tensorflow:Done calling model_fn. INFO:tensorflow:Create CheckpointSaverHook. INFO:tensorflow: Graph was finalized. INFO:tensorflow:Running local_init_op. INFO:tensorflow:Done running local_init_op. INFO:tensorflow:Saving checkpoints for 1 into train/linreg/model.ckpt. INFO:tensorflow:loss = 40.060104, step = 1 INFO:tensorflow:global_step/sec: 197.061 INFO:tensorflow:loss = 10.62989, step = 101 (0.508 sec) INFO:tensorflow:global_step/sec: 172.487 INFO:tensorflow:loss = 11.255318, step = 201 (0.584 sec) INFO:tensorflow:global_step/sec: 193.295 INFO:tensorflow:loss = 10.604872, step = 301 (0.513 sec) INFO:tensorflow:global_step/sec: 175.378 INFO:tensorflow:loss = 10.090343, step = 401 (0.572 sec) INFO:tensorflow:global_step/sec: 209.737 INFO:tensorflow:loss = 10.057928, step = 501 (0.476 sec) INFO:tensorflow:global_step/sec: 171.646 INFO:tensorflow:loss = 10.460144, step = 601 (0.583 sec) INFO:tensorflow:global_step/sec: 192.269 INFO:tensorflow:loss = 10.529617, step = 701 (0.519 sec) INFO:tensorflow:global_step/sec: 198.264 INFO:tensorflow:loss = 9.100082, step = 801 (0.504 sec) INFO:tensorflow:global_step/sec: 226.842 INFO:tensorflow:loss = 10.485607, step = 901 (0.441 sec) INFO:tensorflow:global_step/sec: 152.929 INFO:tensorflow:loss = 10.052481, step = 1001 (0.655 sec) INFO:tensorflow:global_step/sec: 166.745 INFO:tensorflow:loss = 11.320213, step = 1101 (0.600 sec) INFO:tensorflow:global_step/sec: 161.854 INFO:tensorflow:loss = 9.603306, step = 1201 (0.619 sec) INFO:tensorflow:global_step/sec: 179.074 INFO:tensorflow:loss = 11.110269, step = 1301 (0.556 sec) INFO:tensorflow:global_step/sec: 202.776 INFO:tensorflow:loss = 11.929443, step = 1401 (0.494 sec) INFO:tensorflow:global_step/sec: 144.161 INFO:tensorflow:loss = 11.951693, step = 1501 (0.694 sec) INFO:tensorflow:global_step/sec: 154.144 INFO:tensorflow:loss = 8.620987, step = 1601 (0.649 sec) INFO:tensorflow:global_step/sec: 151.094 INFO:tensorflow:loss = 10.666125, step = 1701 (0.663 sec) INFO:tensorflow:global_step/sec: 193.644 INFO:tensorflow:loss = 11.0349865, step = 1801 (0.516 sec) INFO:tensorflow:global_step/sec: 189.707 INFO:tensorflow:loss = 9.860596, step = 1901 (0.526 sec) INFO:tensorflow:global_step/sec: 176.423 INFO:tensorflow:loss = 10.695, step = 2001 (0.567 sec) INFO:tensorflow:global_step/sec: 213.066 INFO:tensorflow:loss = 10.426752, step = 2101 (0.471 sec) INFO:tensorflow:global_step/sec: 220.975 INFO:tensorflow:loss = 10.594796, step = 2201 (0.452 sec) INFO:tensorflow:global_step/sec: 219.289 INFO:tensorflow:loss = 10.4212265, step = 2301 (0.456 sec) INFO:tensorflow:global_step/sec: 215.123 INFO:tensorflow:loss = 9.668612, step = 2401 (0.465 sec) INFO:tensorflow:global_step/sec: 175.65 INFO:tensorflow:loss = 10.009649, step = 2501 (0.569 sec) INFO:tensorflow:global_step/sec: 206.962 INFO:tensorflow:loss = 10.477722, step = 2601 (0.483 sec) INFO:tensorflow:global_step/sec: 229.627 INFO:tensorflow:loss = 9.877638, step = 2701 (0.435 sec) INFO:tensorflow:global_step/sec: 195.792 INFO:tensorflow:loss = 10.274586, step = 2801 (0.512 sec) INFO:tensorflow:global_step/sec: 176.803 INFO:tensorflow:loss = 10.061047, step = 2901 (0.566 sec) INFO:tensorflow:Saving checkpoints for 3000 into train/linreg/model.ckpt. INFO:tensorflow: Loss for the final step: 10.73032. <tensorflow.python.estimator.canned.dnn.DNNRegressor at 0x1818e63630> For Windows user To launch TensorBoard, we can use this code
Next TopicTensorFlow vs PyTorch
|
 For Videos Join Our Youtube Channel: Join Now
Feedback
- Send your Feedback to [email protected]
Help Others, Please Share


