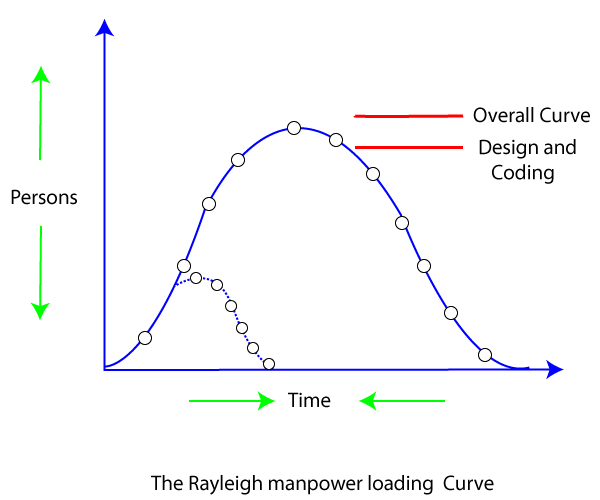
Putnam Resource Allocation ModelThe Lawrence Putnam model describes the time and effort requires finishing a software project of a specified size. Putnam makes a use of a so-called The Norden/Rayleigh Curve to estimate project effort, schedule & defect rate as shown in fig: 
Putnam noticed that software staffing profiles followed the well known Rayleigh distribution. Putnam used his observation about productivity levels to derive the software equation: 
The various terms of this expression are as follows: K is the total effort expended (in PM) in product development, and L is the product estimate in KLOC . td correlate to the time of system and integration testing. Therefore, td can be relatively considered as the time required for developing the product. Ck Is the state of technology constant and reflects requirements that impede the development of the program. Typical values of Ck = 2 for poor development environment Ck= 8 for good software development environment Ck = 11 for an excellent environment (in addition to following software engineering principles, automated tools and techniques are used). The exact value of Ck for a specific task can be computed from the historical data of the organization developing it. Putnam proposed that optimal staff develop on a project should follow the Rayleigh curve. Only a small number of engineers are required at the beginning of a plan to carry out planning and specification tasks. As the project progresses and more detailed work are necessary, the number of engineers reaches a peak. After implementation and unit testing, the number of project staff falls. Effect of a Schedule change on CostPutnam derived the following expression: 
Where, K is the total effort expended (in PM) in the product development L is the product size in KLOC td corresponds to the time of system and integration testing Ck Is the state of technology constant and reflects constraints that impede the progress of the program Now by using the above expression, it is obtained that, 
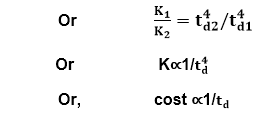
For the same product size, C =L3 / Ck3 is a constant. 
(As project development effort is equally proportional to project development cost) From the above expression, it can be easily observed that when the schedule of a project is compressed, the required development effort as well as project development cost increases in proportion to the fourth power of the degree of compression. It means that a relatively small compression in delivery schedule can result in a substantial penalty of human effort as well as development cost. For example, if the estimated development time is 1 year, then to develop the product in 6 months, the total effort required to develop the product (and hence the project cost) increases 16 times.
Next TopicRisk Management
|
 For Videos Join Our Youtube Channel: Join Now
Feedback
- Send your Feedback to [email protected]
Help Others, Please Share


