| |

Project Management ToolsTo manage the Project management system adequately and efficiently, we use Project management tools. Here are some standard tools: Gantt chartGantt Chart first developed by Henry Gantt in 1917. Gantt chart usually utilized in project management, and it is one of the most popular and helpful ways of showing activities displayed against time. Each activity represented by a bar. Gantt chart is a useful tool when you want to see the entire landscape of either one or multiple projects. It helps you to view which tasks are dependent on one another and which event is coming up. 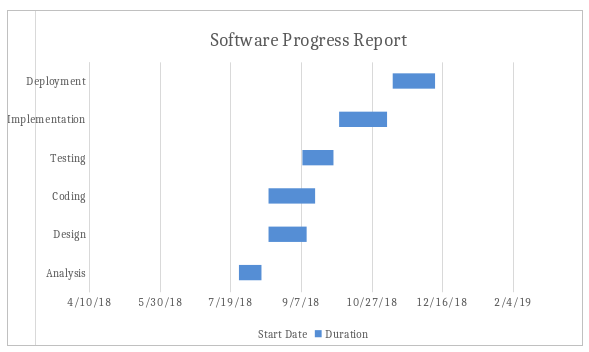
PERT chart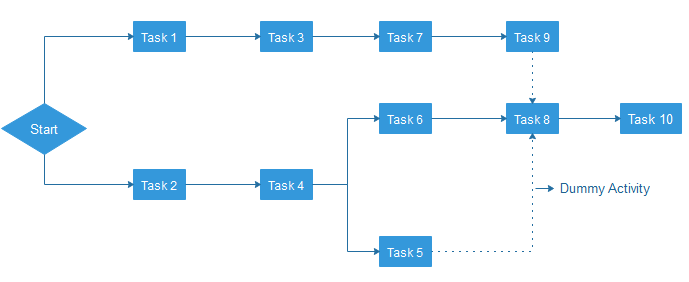
PERT is an acronym of Programme Evaluation Review Technique. In the 1950s, it is developed by the U.S. Navy to handle the Polaris submarine missile programme. In Project Management, PERT chart represented as a network diagram concerning the number of nodes, which represents events. The direction of the lines indicates the sequence of the task. In the above example, tasks between "Task 1 to Task 9" must complete, and these are known as a dependent or serial task. Between Task 4 and 5, and Task 4 and 6, nodes are not depended and can undertake simultaneously. These are known as Parallel or concurrent tasks. Without resource or completion time, the task must complete in the sequence which is considered as event dependency, and these are known as Dummy activity and represented by dotted lines. Logic NetworkThe Logic Network shows the order of activities over time. It shows the sequence in which activities are to do. Distinguishing events and pinning down the project are the two primary uses. Moreover, it will help with understanding task dependencies, a timescale, and overall project workflow. Product Breakdown Structure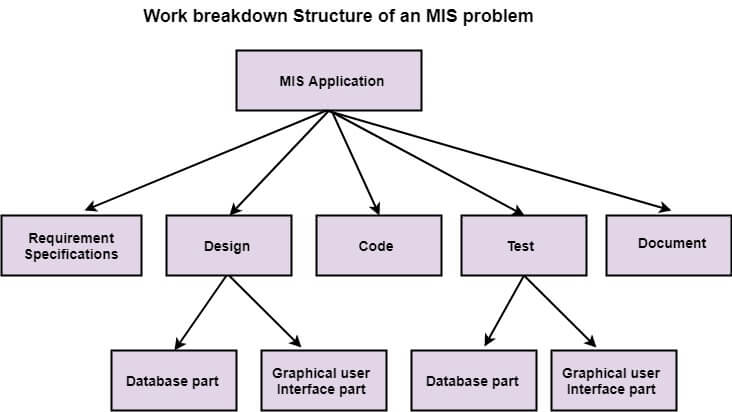
Product Breakdown Structure (BBS) is a management tool and necessary a part of the project designing. It's a task-oriented system for subdividing a project into product parts. The product breakdown structure describes subtasks or work packages and represents the connection between work packages. Within the product breakdown Structure, the project work has diagrammatically pictured with various types of lists. The product breakdown structure is just like the work breakdown structure (WBS). Work Breakdown StructureIt is an important project deliverable that classifies the team's work into flexible segments. "Project Management Body of Knowledge (PMBOK)" is a group of terminology that describes the work breakdown structure as a "deliverable-oriented hierarchical breakdown of the work which is performed by the project team." There are two ways to generate a Work Breakdown Structure ? The top-down and The bottom-up approach. In the top-down approach, the WBS derived by crumbling the overall project into subprojects or lower-level tasks. The bottom-up approach is more alike to a brainstorming exercise where team members are asked to make a list of low-level tasks which is required to complete the project. Resource HistogramThe resource histogram is precisely a bar chart that used for displaying the amounts of time that a resource is scheduled to be worked on over a prearranged and specific period. Resource histograms can also contain the related feature of resource availability, used for comparison on purposes of contrast. Critical Path AnalysisCritical path analysis is a technique that is used to categorize the activities which are required to complete a task, as well as classifying the time which is needed to finish each activity and the relationships between the activities. It is also called a critical path method. CPA helps in predicting whether a project will expire on time.
Next TopicSoftware Metrics
|
 For Videos Join Our Youtube Channel: Join Now
Feedback
- Send your Feedback to [email protected]
Help Others, Please Share


