| |

Functional Point (FP) AnalysisAllan J. Albrecht initially developed function Point Analysis in 1979 at IBM and it has been further modified by the International Function Point Users Group (IFPUG). FPA is used to make estimate of the software project, including its testing in terms of functionality or function size of the software product. However, functional point analysis may be used for the test estimation of the product. The functional size of the product is measured in terms of the function point, which is a standard of measurement to measure the software application. Objectives of FPAThe basic and primary purpose of the functional point analysis is to measure and provide the software application functional size to the client, customer, and the stakeholder on their request. Further, it is used to measure the software project development along with its maintenance, consistently throughout the project irrespective of the tools and the technologies. Following are the points regarding FPs 1. FPs of an application is found out by counting the number and types of functions used in the applications. Various functions used in an application can be put under five types, as shown in Table: Types of FP Attributes
All these parameters are then individually assessed for complexity. The FPA functional units are shown in Fig: 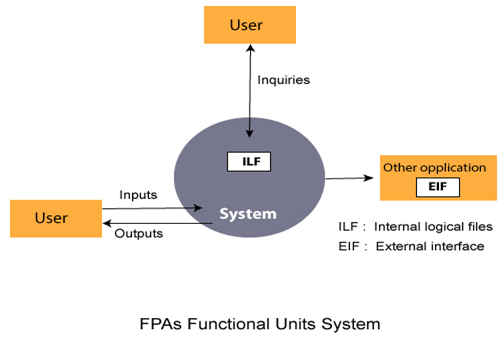
2. FP characterizes the complexity of the software system and hence can be used to depict the project time and the manpower requirement. 3. The effort required to develop the project depends on what the software does. 4. FP is programming language independent. 5. FP method is used for data processing systems, business systems like information systems. 6. The five parameters mentioned above are also known as information domain characteristics. 7. All the parameters mentioned above are assigned some weights that have been experimentally determined and are shown in Table Weights of 5-FP Attributes
The functional complexities are multiplied with the corresponding weights against each function, and the values are added up to determine the UFP (Unadjusted Function Point) of the subsystem. 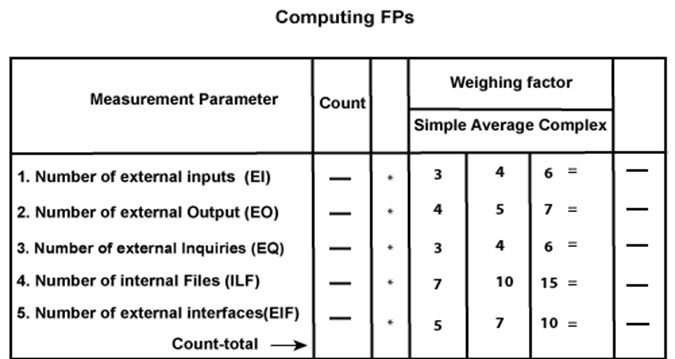
Here that weighing factor will be simple, average, or complex for a measurement parameter type. The Function Point (FP) is thus calculated with the following formula. FP = Count-total * [0.65 + 0.01 * ∑(fi)] where Count-total is obtained from the above Table. CAF = [0.65 + 0.01 *∑(fi)] and ∑(fi) is the sum of all 14 questionnaires and show the complexity adjustment value/ factor-CAF (where i ranges from 1 to 14). Usually, a student is provided with the value of ∑(fi) Also note that ∑(fi) ranges from 0 to 70, i.e., 0 <= ∑(fi) <=70 and CAF ranges from 0.65 to 1.35 because
Based on the FP measure of software many other metrics can be computed:
8. LOCs of an application can be estimated from FPs. That is, they are interconvertible. This process is known as backfiring. For example, 1 FP is equal to about 100 lines of COBOL code. 9. FP metrics is used mostly for measuring the size of Management Information System (MIS) software. 10. But the function points obtained above are unadjusted function points (UFPs). These (UFPs) of a subsystem are further adjusted by considering some more General System Characteristics (GSCs). It is a set of 14 GSCs that need to be considered. The procedure for adjusting UFPs is as follows:
Remember that the value of VAF lies within 0.65 to 1.35 because
Example: Compute the function point, productivity, documentation, cost per function for the following data:
Various processing complexity factors are: 4, 1, 0, 3, 3, 5, 4, 4, 3, 3, 2, 2, 4, 5. Solution:
So sum of all fi (i ← 1 to 14) = 4 + 1 + 0 + 3 + 5 + 4 + 4 + 3 + 3 + 2 + 2 + 4 + 5 = 43 FP = Count-total * [0.65 + 0.01 *∑(fi)] 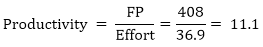
Total pages of documentation = technical document + user document Documentation = Pages of documentation/FP 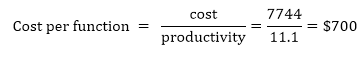
Differentiate between FP and LOC
Next TopicExtended Function Point (EFP) Metrics
|
 For Videos Join Our Youtube Channel: Join Now
Feedback
- Send your Feedback to [email protected]
Help Others, Please Share


