| |

JavaFX LineChartIn general, the Line Chart is defined as the type of graph in which the group of data points called markers are used to display the information. In Line Chart, the markers are plotted on the mapping points between the two Number axes. The markers are connected by the line segments. Basically, the line chart shows the deviation in the values of one axis with respect to the change in values of other axis. In the following image, the line chart shows the variation in the price of Milk over the last 8 years. On the Y axis, the price is shown while on the X axis, the years are shown. 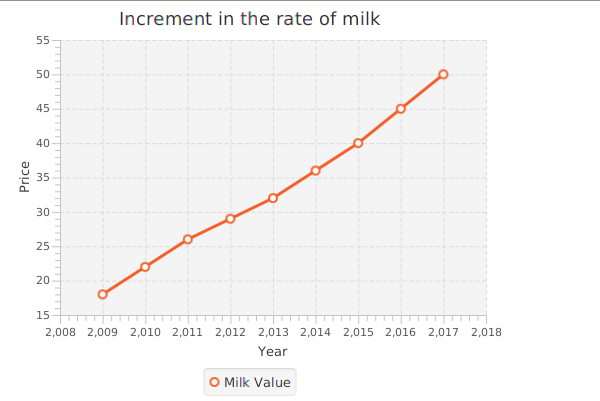
In JavaFX, the Line Chart is represented by the class javafx.scene.chart.LineChart PropertiesThe properties of the class along with the setter methods are described in the following table.
ConstructorsThere are two constructors in the class.
ExampleIn the following example, we have shown the variation in the share price of a stock in the different years. 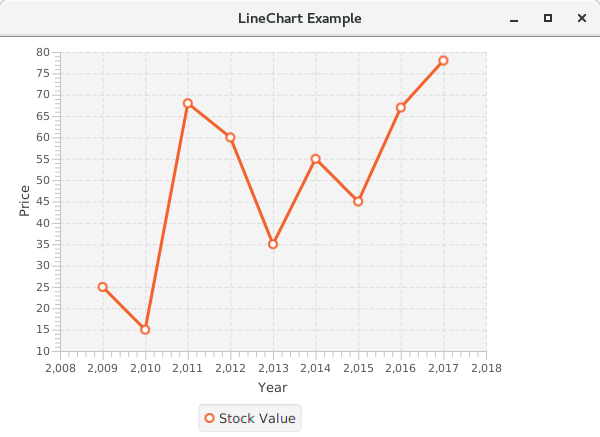
Next TopicJavaFX Area Chart
|
 For Videos Join Our Youtube Channel: Join Now
Feedback
- Send your Feedback to [email protected]
Help Others, Please Share


