| |

<apex: barSeries> Component in Visualforce PageThe <apex: barSeries> is another important component that acts as a data series to be rendered as bars in the Visualforce chart. We have to specify the data collection fields to use as X and Y values for each point and the X and Y axes to scale against. We have to use this component within the <apex: chart> component, and inside <apex: chart> component, we can use more than one <apex: barSeries> component. The <apex: barSeries> has the following attributes on Visualforce Page: 1. axis The axis is a string-type attribute used for specifying the axis this chart series should bind. The value of this attribute can be one of the following:
Syntax: 2. colorSet The colorSet is a string-type attribute used for specifying a set of the color values used as the bar fill color. The value for this attribute is specified as a comma-separated HTML-style colors string. Syntax: 3. colorsProgressWithinSeries The colorProgressWithinSeries is a Boolean-type attribute that specifies how to progress through the values of the colorSet attribute. Syntax: 4. groupGutter The groupGutter is an integer-type attribute used for specifying the spacing between groups of bars as the percentage of the bar width. Syntax: 4. gutter The gutter is an integer-type attribute used for specifying the spacing between individual bars as a percentage of the bar width. Syntax: 6. highlight The highlight is a Boolean-type attribute that specifies whether each bar should be highlighted when the mouse hovers over it. Boolean-value true is set as a default value for this attribute. Syntax: 7. highlightColor The highlightColor is a string-type attribute used to specify the HTML-style color overlayed on a bar when it's highlighted. Syntax: 8. highlightLineWidth The highlightLineWidth is an Integer-type attribute used to specify the width of the line in pixels surrounding a bar when it's highlighted. Syntax: 9. highlightOpacity The highlightOpacity is a string-type attribute used for specifying the decimal number between 0 and 1, representing the opacity of the color overlay on a bar when it's highlighted. Syntax: 10. highlightStroke The highlightStroke is a string-type attribute used to specify the HTML-style color of the line surrounding a bar when it's highlighted. Syntax: 11. id The id is a string-type attribute, i.e., a unique identifier that allows this component to be referenced by other components on the page. Syntax: 12. orientation The orientation is a string-type attribute used for specifying the direction of the bars in the chart. The horizontal and vertical are two possible values for this attribute. Syntax: 13. rendered The rendered is a Boolean-type attribute that specifies whether the chart series is rendered in the chart. Boolean-value true is set as a default value for this attribute. Syntax: 14. renderedFn The renderedFn is a string-type attribute used for specifying the name of the JavaScript function that augments or overrides how each data point is rendered. The JavaScript method implements to provide additional styling or to augment data. Syntax: 15. showInLegend The showInLegend is a Boolean-type attribute used to specify whether the chart series should be added to the chart legend. Boolean-value true is set as a default value for this attribute. Syntax: 16. stacked The stacked is a Boolean-type attribute used for specifying whether to group or stack bar values. Syntax: 17. tips The "tips" is a Boolean-type attribute used for specifying whether we need to display a tooltip for each bar when the mouse hovers over it. Boolean-value true is set as a default value for this attribute. Syntax: 18. title The title is a string-type attribute used for specifying the title of this chart series displayed in the chart legend. Syntax: 19. xField The field in each record is provided in the chart data from which to retrieve the x-axis value for each data point in the series. This field must exist in every record in the chart data. Syntax: 20. yField The field in each record is provided in the chart data from which to retrieve the y-axis value for each data point in the series. This field must exist in every record in the chart data. Syntax: 21. xPadding The xPadding is an integer-type attribute that specifies the padding in pixels between the left and right axes and the chart's bar. Syntax: 22. yPadding The yPadding is an integer-type attribute used to specify the padding in pixels between the top and bottom axes and the chart's bar. Syntax: Let's take an example to understand how we can use the <apex: barSeries> component on the Visualforce page. ApexBarSeriesExample.vfp ApexBarSeriesController.apxc Output 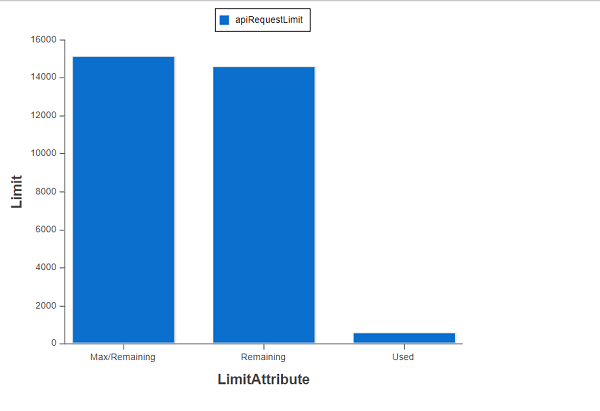
|
 For Videos Join Our Youtube Channel: Join Now
Feedback
- Send your Feedback to [email protected]
Help Others, Please Share


