| |

<apex: lineSeries> Component in Visualforce PageThe <apex: lineSeries> is another important component that acts as a data series to be rendered as connected points in a linear Visualforce chart. We have to specify the data collection fields to use as X and Y values for each point and the X and Y axes to scale against. We have to use this component within the <apex: chart> component, and inside <apex: chart> component, we can use more than one <apex: lineSeries> component. The <apex: lineSeries> has the following attributes on Visualforce Page: 1. axis The axis is a string-type attribute used for specifying the axis this chart series should bind. The value of this attribute can be one of the following:
Syntax: 2. fill The fill is a Boolean-type attribute that specifies whether the underline area should be filled. The boolean value false is set as a default value for this attribute. Syntax: 3. fillColor The fillColor is a string-type attribute used for specifying the color, i.e., used to fill the underline color area. Syntax: 4. highlight The highlight is a Boolean-type attribute used for specifying whether each point of the line series should be highlighted or not when the onmouseover event occurs. The boolean value true is set as a default value for this attribute. Syntax: 5. highlightStrokeWidth The highlightStrokeWidth is a string-type attribute used for specifying the width of the line drawn over the series line when it's highlighted. Syntax: 6. id The id is a string-type attribute, i.e., a unique identifier that allows this component to be referenced by other components on the page. Syntax: 7. markerFill The markerFill is a string-type attribute that is used for specifying the color of the data point markers for this series. The value of this attribute is specified as an HTML-style color. Syntax: 8. markerSize The markerSize is an Integer-type attribute used for specifying the size of each data point marker for this series. By default, its value is set to 3. Syntax: 9. markerType The markerType is a string-type attribute used for specifying the shape of each data point marker for this series. These are the possible values for this attribute:
By default, the marker shape is chosen from a sequence of shapes. Syntax: 10. opacity The opacity is a string-type attribute used for specifying a decimal number between 0 and 1, indicating the opacity of the filled area under the line for the series. By default, its value is set to 0.3 only when the fill attribute is set to true. Syntax: 11. rendered The rendered is a Boolean-type attribute that specifies whether the chart series is rendered in the chart. Boolean-value true is set as a default value for this attribute. Syntax: 12. renderedFn The renderedFn is a string-type attribute used for specifying the name of the JavaScript function that augments or overrides how each data point is rendered. The JavaScript method implements to provide additional styling or to augment data. Syntax: 13. showInLegend The showInLegend is a Boolean-type attribute used to specify whether the chart series should be added to the chart legend or not. Boolean-value true is set as a default value for this attribute. Syntax: 14. smooth The smooth is an integer-type attribute used for specifying the amount of smoothing for the line, with lower numbers applying more smoothing. Syntax: 15. strokeColor The strokeColor is a string-type attribute used for specifying the color of the line for this series. Syntax: 16. tips The "tips" is a Boolean-type attribute used for specifying whether we need to display a tooltip for each data point or not when the mouse hovers over it. Boolean-value true is set as a default value for this attribute. Syntax: 17. title The title is a string-type attribute used for specifying the title of this chart series displayed in the chart legend. Syntax: 18. strokeWidth The strokeWidth is an integer-type attribute used to specify the line width for the series. Syntax: 19. xField The field in each record is provided in the chart data from which to retrieve the x-axis value for each data point in the series. This field must exist in every record in the chart data. Syntax: 20. yField The field in each record is provided in the chart data from which to retrieve the y-axis value for each data point in the series. This field must exist in every record in the chart data. Syntax: Let's take an example to understand how we can use the <apex: lineSeries> component on the Visualforce page. ApexLineSeriesExample.vfp LineSeriesController.apxc Output 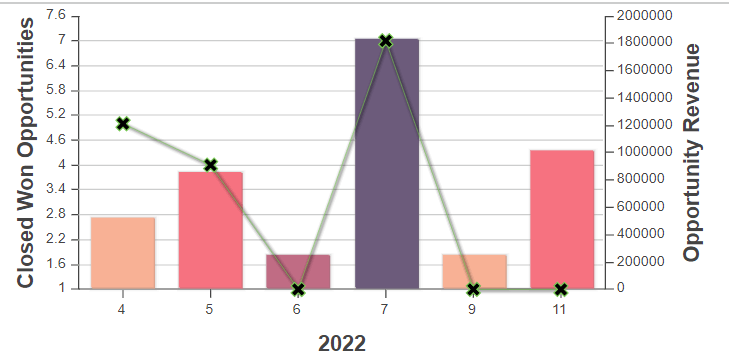
|
 For Videos Join Our Youtube Channel: Join Now
Feedback
- Send your Feedback to [email protected]
Help Others, Please Share


