| |
Python Tutorial
Python OOPs
Python MySQL
Python MongoDB
Python SQLite
Python Questions
Plotly
Python Tkinter (GUI)
Python Web Blocker
Python MCQ
Related Tutorials
Python Programs

How to Limit the Width and Height in Pygal?What is Pygal?PyGal, an open-source library in Python, is the most important library for data visualization, used for making highly interactive plots and charts for various datasets. It is a graphics and user interface library that offers a variety of functions that can be used in designing and science applications. We can get the visualizations in SVG (Scalable Vector Graphics), PNG (Portable Network Graphics), Etree, Base64 data URI, Browser, and PyQuery. It can be customized in different applications accordingly. We can change the size of the graphs according to the requirement. The Pygal library provides different methods to resize the graphs and charts made with the Pygal library in Python. Let's see the steps we will use to change the charts' width and height in Pygal. Step 1: We will import the mandatory libraries for making charts and graphs, including Pygal. Step 2: After importing the library, we will make the chart object which will be used to make the charts and graphs. Step 3: Now, we will pass the width or height in the function of the charts. Step 4: Then, we will label the graph and display it. Let's understand the concept of resizing the charts and graphs with a few examples implemented in Python. Example 1: Program to make a bar graph with specific height and width. Code: Output: 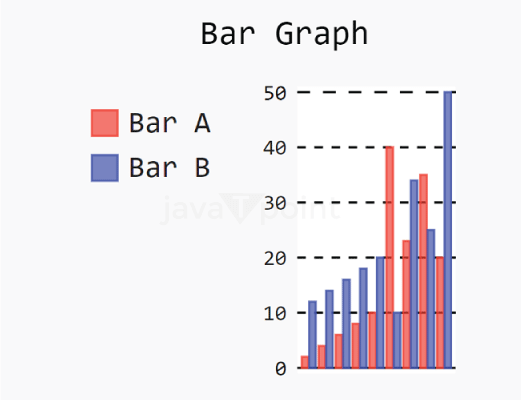
Explanation: We have made a bar chart with a fixed height and width of 200. We can change the dimensions accordingly. Example 2: Program to make a line graph with specific dimensions. Code: Output: 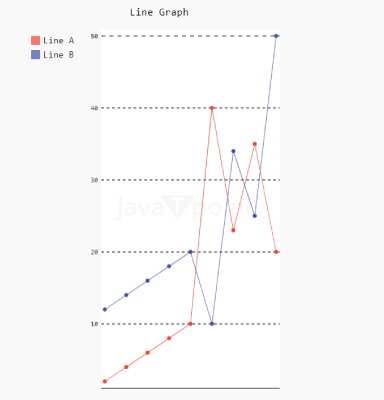
Explanation: We have made a line chart in which we have just assigned a width of 400. We can make charts with just height or width. We can add spacing and margins to the graphs. Example 3: Adding Spaces into the graph Code: Output: 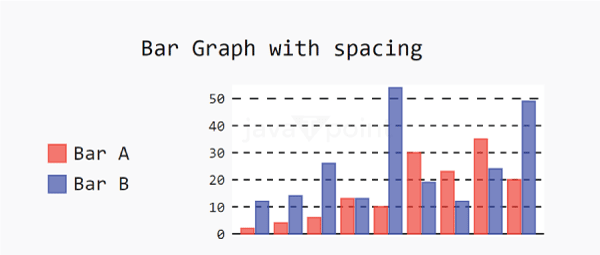
Explanation: We have made a bar chart and added spaces = 40 between each bar. And we have also fixed its dimension. Example 4: Adding Margins into the graph Code: Output: 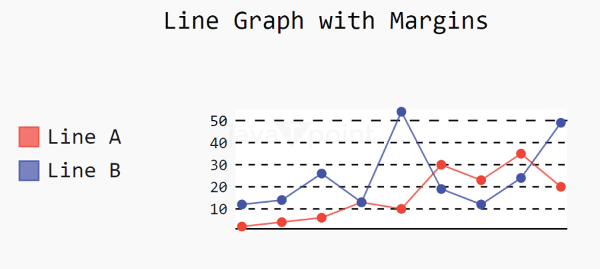
Explanation: We have made a Line chart and added margin= 50 in the chart. And we have also fixed its dimension.
Next TopicHow to Suppress Warnings in Python
|
 For Videos Join Our Youtube Channel: Join Now
Feedback
- Send your Feedback to [email protected]
Help Others, Please Share


