| |

Python memory-profiler ModuleWe all may have heard about slow processing or slow execution of an application, but ever we have tried to understand the reason behind it? There is a possible reason for the time application is taking to process or execute our commands, but what about RAM usage? RAM or memory of the system is very much essential for the processing and execution time of an application, but nobody actually talks about it. How much memory (RAM) is used while executing or processing the command also affects the application's execution speed. This may sound ridiculous or insignificant to us, but it plays a very important role in the performance of our system and the applications installed in it. Therefore, it is quite common that applications that have less RAM will take high time to execute compared to applications that have more RAM. This same thing is applicable while executing a program, and that's why it is very important to see how much memory is used while executing a program. This will help us manage the memory usage or design the program in a better way and keep memory usage in mind. But now, some questions will come to our mind, such as how we can do this, track a program's memory usage, or find out which functions of the program use more memory and make its execution slow? We have a memory profiling module in Python, which helps us track the memory usage by a program and its functions. We are going to learn about the Python memory-profiler module in this tutorial, and we will learn how we can use this module to track the RAM used with distribution while executing a program. Introduction to memory-profiler Module of Pythonmemory-profiler is an open-source Python module that offers us the functions to track memory consumption of a program while its execution, and we can even monitor memory consumption with line-by-line analysis in the program and functions of the program. the memory-profiler module also helps us analyze the performance of the Python and how much the performance & execution speed is affected by the RAM consumption during its execution. Here, we will discuss the installation and implementation of the memory-profiler module with the help of example programs, but first, we will learn about what are the advantages and features of this module. memory-profiler Module of Python: Advantages & FeaturesMost of us may have seen many people complaining that Python is a slow programming language compared to others, and it takes more time to execute a program or application. Well, if we have asked them what approach they are using to calculate the speed of execution, the first answer we will receive is the total time spent by Python to execute the code or part of a code or something like this. But we will see that none of them will talk about usage or how much RAM is used while executing that particular part of the code. It may seem like very insignificant information regarding the program's execution speed, but actually, it is very important, which affects the speed of Python for executing a program. Therefore, it is equally important to analyze the memory usage during the execution of a program which becomes possible because of the memory-profiler module of Python. Python memory-profiler module has the following features and advantages regarding monitoring and analyzing memory usage by a program during the execution:
These are some advantages of using the memory-profiler module, and it also helps us improve the performance of Python. memory-profiler Module of Python: Installationmemory-profiler Module of Python is not an in-built module, and that's why if we want to understand its implementation and use it in the development process, we have to install this module in our system or make sure that this module is properly installed in our system. If the memory-profiler is not present in our system, we can install it through various methods, but the simplest way which we can choose is installing it through the pip installer. Therefore, in this installation part, we are going to install the memory-profiler module through the pip installer by using the following command: First, we have to write the command given above in the command prompt terminal shell, and after that, we have to press the 'enter' key to start the installation process. Once the installation process starts, it will take some time, and we have to wait until it is successfully installed in our system. 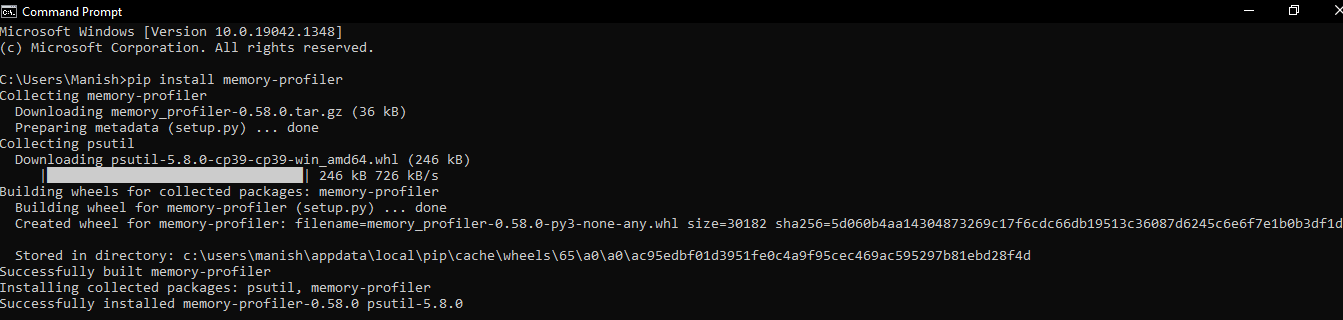
As we can see, the memory-profiler is successfully installed in our system, and now we can move further with the implementation of it, and we can now even use this module for development purposes. Note: In the implementation part of this tutorial, we will use the request module with the memory-profiler module in one of the example programs to understand the real-life implementation and usage of memory tracking and analysis through the memory-profiler module. Therefore, before we move forward with the implementation part, we should make sure that the request module is present in our system, and if it is not present in our system, we can install it from the pip installer using the following pip command in the terminal: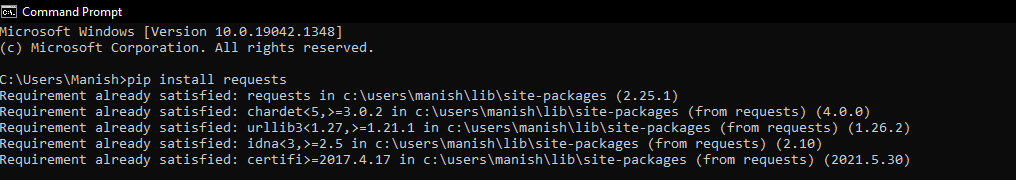
As we can see, the requests module is already present in our system, and that's why a requirement already satisfied message is displayed to us. The memory-profiler Module of Python: ImplementationWe will use here two examples to understand the implementation of the memory-profiler module, and we will analyze the memory usage in the program when the result is displayed in the output. Let's have a look at the following two example programs to understand the implementation of the memory-profiler module: Implementation 1: Analysing memory usage from a default function:In this implementation part, we will create a default function in the example program and define some variables in it, and after that, we will perform some operations on these variables. We will then analyze the memory usage by each line of the program when the result is displayed in the output. Let's look at the following example program to understand this implementation part of the memory-profiler module. Example 1: Output: Filename: C:\Users\Manish\memoryexample.py Line # Mem usage Increment Occurences Line Contents ============================================================ 4 40.2 MiB 40.2 MiB 1 @profile 5 # a default function to check memory usage 6 def defFunc(): 7 # Some random variables 8 40.2 MiB 0.0 MiB 1 var1 = [1] * (6 ** 4) 9 40.2 MiB 0.0 MiB 1 var2 = [1] * (2 ** 3) 10 40.2 MiB 0.0 MiB 1 var3 = [2] * (4 * 6 ** 3) 11 # Operations on variable 12 40.2 MiB 0.0 MiB 1 del var3 13 40.2 MiB 0.0 MiB 1 del var1 14 40.2 MiB 0.0 MiB 1 return var2 We have successfully inspected memory usage from the default functi As we can see, memory usage for every line of the program is displayed with the confirmation statement in the last. Explanation: We have first imported the profile decorator class from the memory-profiler module in the program. After that, we used the profile decorator, and then we defined a default function with the name 'defFunc.' Inside this default function, we have defined three variables, and after that, then we deleted the first & third variables and returned the second variable from the function. Then, we called the default function, and after that, we have used a print statement like the confirmation message. In the output of the above example, we can see multiple columns which represent multiple properties that are defined below:
So, that's how we can understand the analysis of the memory usage by a Python program and even by the particular line in the program so that we will know how this function or line of code is affecting the performance and execution time. Implementation 2: Analysing memory usage during an execution process:This implementation part will cover the practical implementation of the memory-profiler module for monitoring and analyzing the memory usage of a Python program. In this implementation part, first, we will create a Python file with the following example program in it: Example 2: After writing the program given above, we will save the file with the 'memoryexample' name, and now we will create another file where we will import this file and write the following Python program in it: Now, we are done with the program writing part, and when we run the second file, we will see the following output:
Filename: C:\Users\Manish\memoryexample.py

Line #    Mem usage    Increment    Occurences    Line Contents
============================================================
  17     44.6 MiB     44.6 MiB           1   	@profile
  18                                            def parseURL(self, url):
  19                                            # fetches the response
  20     51.9 MiB      7.3 MiB           1   	response = requests.get(url).text
  21     51.9 MiB      0.0 MiB           1   	with open('url.txt', 'w') as sampleFile:
  22
  23                                            # writing response to file
  24     52.5 MiB      0.6 MiB           1   	sampleFile.writelines(response)


Filename: C:\Users\Manish\memoryexample.py

Line #    Mem usage    Increment    Occurences    Line Contents
============================================================
  8      47.9 MiB      47.9 MiB       1   	     @profile
  9                                            # Default function for parsing words from list
  10                                         	 def parseList(self, array):
  11                                           # Creating a file type object
  12     47.9 MiB      0.0 MiB       1   	     sampleFile = open('wordParsing.txt', 'w')
  13                                           # looping over the file
  14     47.9 MiB      0.0 MiB       6   	     for parsedWords in array:
  15                                           # Writing words in the example file
  16     47.9 MiB      0.0 MiB       5   	     sampleFile.writelines(parsedWords)

[Finished in 27.1s]
We can see total memory usage during the execution process, and the extraction process of words from the file and URL is displayed in the output. That's how we can analyze and understand a program's memory usage and how it is affecting the performance and execution speed of the program.
Next TopicPython Phonenumbers Module
|
 For Videos Join Our Youtube Channel: Join Now
Feedback
- Send your Feedback to [email protected]
Help Others, Please Share


