| |
Python Tutorial
Python OOPs
Python MySQL
Python MongoDB
Python SQLite
Python Questions
Plotly
Python Tkinter (GUI)
Python Web Blocker
Python MCQ
Related Tutorials
Python Programs

Matplotlib.figure.Figure.add_subplot() in PythonWhat is Matplotlib?In Python, we have a lot of inbuilt libraries which have a lot of useful inbuilt functions which we can use by importing these libraries. Matplotlib is one of the most important libraries in Python, which is used to draw the plots and figures of various types using its inbuilt functions. In the Matplotlib, we have a figure module which is used to draw the plots as well as control the layouts of the plots. add_subplot() functionIt has the add_subplot() function, which is used to add the axes to the subplots of any figure. It helps in determining the layout of the figure. Syntax:Parameters:*args: This parameter means that there would be some number of arguments like the number of rows, number of columns and index value. The index value will start from the one and end at the right value of the column. We can define the index value with two integers also, which will define the row and column values. For example: add_subplot(5,4,3): It means that there would be five rows and four columns, and our subplot would be at the third column. add_subplot(5,4,(2,2)): It means that there will be five rows and four columns, and our subplot will be from the 2nd column of the first row till the 2nd row. projection: It is an optional parameter which accepts values like 'hammer','polar','lambert' etc., which defines the projection type of the subplot. polar: It accepts the boolean value, and if it is set to true, then the projection would be of type 'polar'. sharex,sharey: It shares the x-axis and y-axis with sharex and sharey. label: It accepts the string values, which sets the labels for the axes of the subplot. Return type:This function returns the axes of the subplot, which is plotted in the figure. Example1:Output: 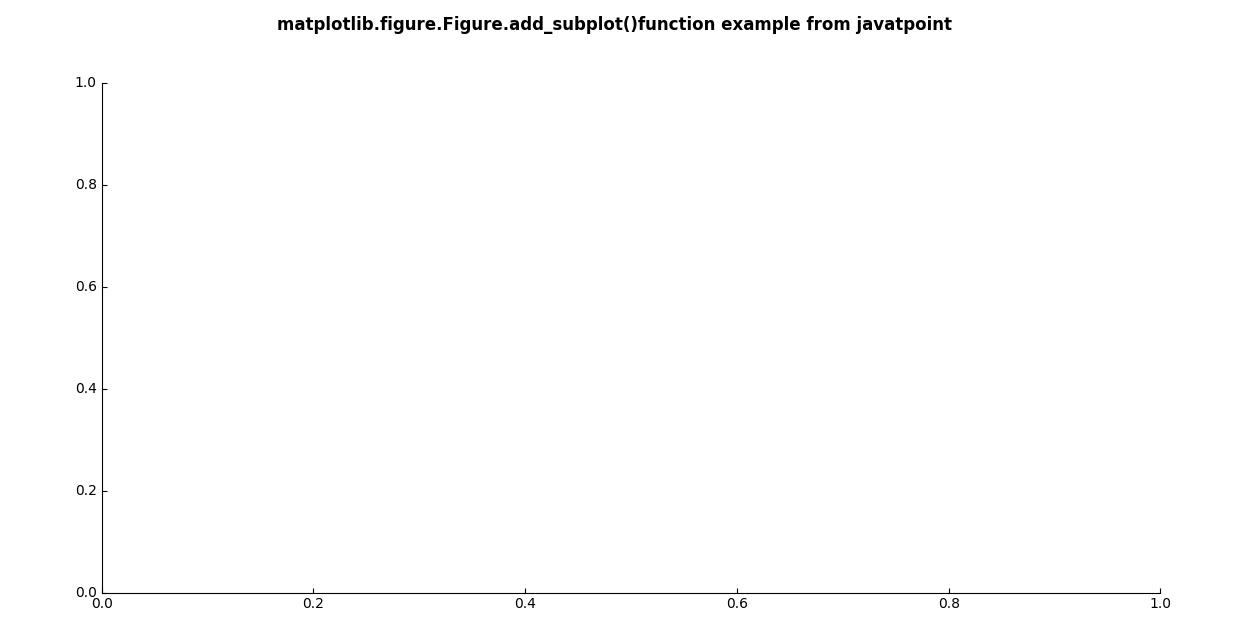
Explanation: In the above code, we have imported the necessary modules, like Matplotlib etc., to use their functions. Now, in the subplot function, we have the value 111, which means we will have 1 row and 1 column and the subplot will be at index1. So we used the add_subplot function to plot this subplot, and we got the subplot in the whole area. We have set the visibility of the right and top axis as false to see only the left and bottom axis of the plot. Example2:Output: 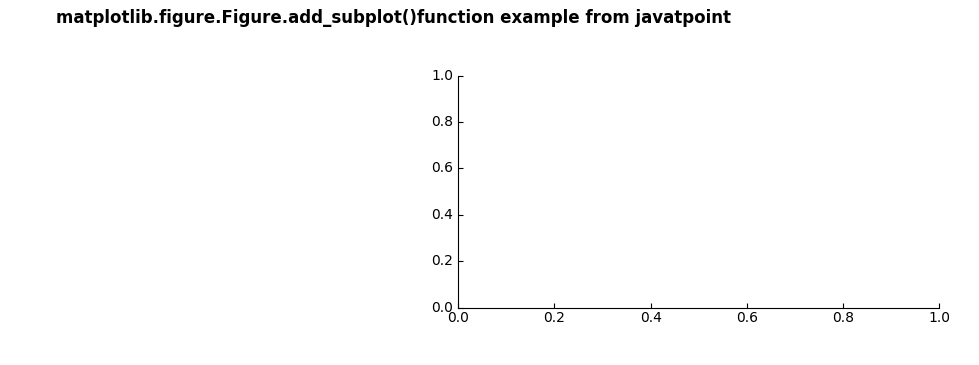
Explanation: If we use 222 then the complete area would be divided into two rows and two columns and then the subplot will be at index two, which will be at the first row and second column. Example 3:Output: 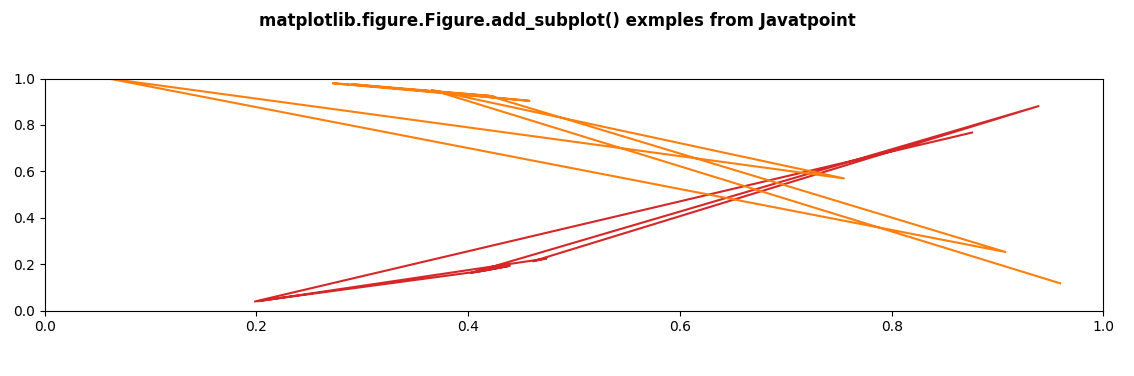
Explanation: In the above code, we used the random dataset from numpy, and we took two datasets for the x-axis and y-axis each, respectively. Then we plotted them using the add_subplot function where we have defined the values as 2,1,1, which means the whole figure is divided into two rows and 1 column. Then we set our subplot in the first column so it will be present in the upper half of the figure. |
 For Videos Join Our Youtube Channel: Join Now
Feedback
- Send your Feedback to [email protected]
Help Others, Please Share


