| |
Python Tutorial
Python OOPs
Python MySQL
Python MongoDB
Python SQLite
Python Questions
Plotly
Python Tkinter (GUI)
Python Web Blocker
Python MCQ
Related Tutorials
Python Programs

Introduction to PyQtGraph Module in PythonAmong software developers, engineers, and data scientists, Python is a well-liked programming language. Its broad library and module collection makes working with data, graphics, and user interfaces simple. One such popularly used package for developing interactive real-time visuals and visualisations is PyQtGraph. You will learn about the PyQtGraph module's features, advantages, and applications in this article. Describe PyQtGraph.PyQtGraph is a Python package for quickly producing real-time, interactive visuals and visualisations. The PyQt framework, a set of Python bindings for the Qt application framework, is the foundation upon which it is built. Custom plots, graphs, and other visualisations can be made using PyQtGraph's robust and adaptable API. Large datasets can be handled by PyQtGraph, which also supports real-time graphic updates. It offers a quick and effective charting engine that makes use of OpenGL for rendering that is hardware-accelerated. This makes it feasible to produce graphics of high quality and scale to enormous data sets without sacrificing performance. Features of PyQtGraphPyQtGraph is a robust and adaptable tool for building interactive visualisations because to its various capabilities. PyQtGraph has a number of important features, including: Real-time plotting: PyQtGraph is suitable for building dynamic and interactive visualisations since it can handle big datasets and update charts in real-time. Fast and effective: PyQtGraph is fast and effective at handling massive datasets and producing high-quality graphics since it employs OpenGL for hardware-accelerated rendering. Adaptable: PyQtGraph offers a versatile API that enables you to alter your plots and visualisations to suit your particular requirements. Interactive capabilities like zooming, panning, and scrolling are supported by PyQtGraph, allowing users to explore and analyse data in real-time. Multiple data formats are supported by PyQtGraph, making it simple to work with data from many sources. These formats supported include CSV, HDF5, and NumPy arrays. Benefits of using PyQtGraphUsing PyQtGraph to produce real-time visuals and visualisations has a number of advantages. Among the main advantages are: Performance: PyQtGraph is the perfect tool for building high-performance graphics and visualisations because it is built to handle huge datasets and update plots in real-time. Flexibility: PyQtGraph offers a versatile API that enables you to modify your plots and visualisations to suit your unique requirements. Cross-platform: PyQtGraph may be used to develop and deploy applications on Windows, Linux, and macOS thanks to its cross-platform nature. Work with data from many sources is made simple by PyQtGraph's strong integration with other Python libraries and modules, such as NumPy, SciPy, and Pandas. Getting started with PyQtGraph.To get started with PyQtGraph, you first need to install it on your system. PyQtGraph can be installed using pip, which is the default package manager for Python. You can install PyQtGraph by running the following command: Once you have installed PyQtGraph, you can start using it in your Python code by importing the library using the following command: PyQtGraph provides a wide range of tools for creating different types of visualizations. For example, to create a simple line plot, you can use the following code: Output: 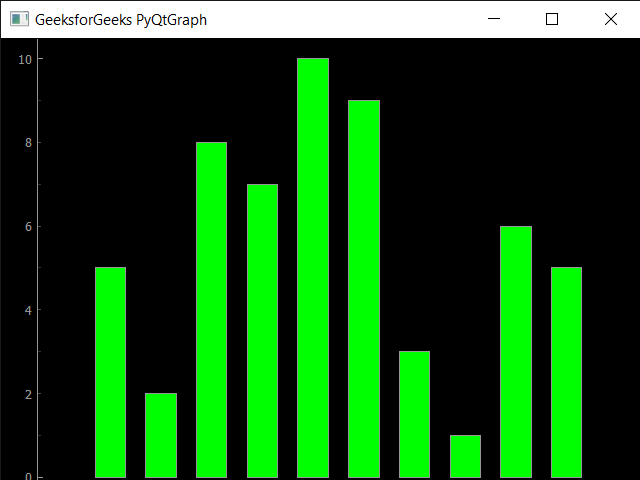
For plots and visualisations, PyQtGraph offers a wide range of customization possibilities. For instance, the plot() method's pen option allows you to alter the line's colour. The setLabel() and addLegend() methods can also be used to add labels and legends. ConclusionPython's PyQtGraph module is a potent and adaptable tool for building real-time visuals and visualisations. It offers a quick and effective plotting engine that can manage big datasets and instantly update graphs. Additionally, very configurable and easily integrated with other Python tools and modules is PyQtGraph. It has numerous uses in machine learning, engineering simulation, financial analysis, and scientific visualisation. PyQtGraph is unquestionably worthwhile investigating if you're interested in using Python to build interactive and dynamic visualisations.
Next TopicLazy Evolution in Python
|
 For Videos Join Our Youtube Channel: Join Now
Feedback
- Send your Feedback to [email protected]
Help Others, Please Share


