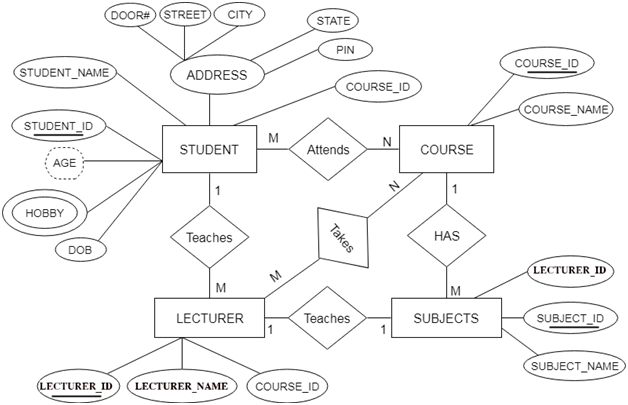
Reduction of ER diagram to TableThe database can be represented using the notations, and these notations can be reduced to a collection of tables. In the database, every entity set or relationship set can be represented in tabular form. The ER diagram is given below: 
There are some points for converting the ER diagram to the table:
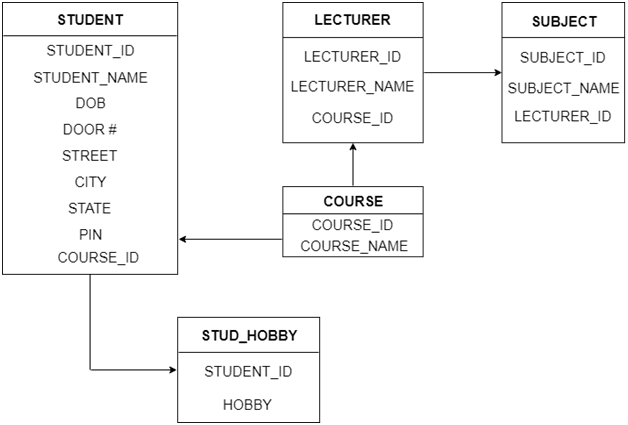
In the given ER diagram, LECTURE, STUDENT, SUBJECT and COURSE forms individual tables.
In the STUDENT entity, STUDENT_NAME and STUDENT_ID form the column of STUDENT table. Similarly, COURSE_NAME and COURSE_ID form the column of COURSE table and so on.
In the given ER diagram, COURSE_ID, STUDENT_ID, SUBJECT_ID, and LECTURE_ID are the key attribute of the entity.
In the student table, a hobby is a multivalued attribute. So it is not possible to represent multiple values in a single column of STUDENT table. Hence we create a table STUD_HOBBY with column name STUDENT_ID and HOBBY. Using both the column, we create a composite key.
In the given ER diagram, student address is a composite attribute. It contains CITY, PIN, DOOR#, STREET, and STATE. In the STUDENT table, these attributes can merge as an individual column.
In the STUDENT table, Age is the derived attribute. It can be calculated at any point of time by calculating the difference between current date and Date of Birth. Using these rules, you can convert the ER diagram to tables and columns and assign the mapping between the tables. Table structure for the given ER diagram is as below: 
Figure: Table structure
Next TopicDBMS Relationship of Higher Degree
|
 For Videos Join Our Youtube Channel: Join Now
Feedback
- Send your Feedback to [email protected]
Help Others, Please Share


